Alarm substance-induced fear conditioning and GPR139 antagonist and agonist treatment timeline during the conditioning. (A) Schematic of treatment timeline. After an acclimatization of 1 week, fish were given a choice of their preferred color (Day 1), either a yellow or white colored compartment (basal preference). On Day 2 (conditioning phase), fish were individually placed into the compartment, and after 5 min of acclimatization time, AS was delivered in water, followed by 5 min of video recording. The fish were then immediately transferred into the non-preferred compartment of the new experimental tank and exposed to 2 mL of distilled water (H2O) for 5 min. Intracranial injection of GPR139 antagonist and intraperitoneal injection of GPR139 agonist were then administered after 60 min of the recovery from the conditioned stimuli, and fish were transferred to their respective home tank. On Day 3 (post-conditioning phase), change in preference was assessed based on their total time spent in AS-paired (originally preferred) compartment as compared to the initial preference. (B) Schematic representation of conspecific alarm substance (AS)-induced fear conditioning paradigm. Adopted by Sivalingam et al. (2020) (Created with BioRender.com).

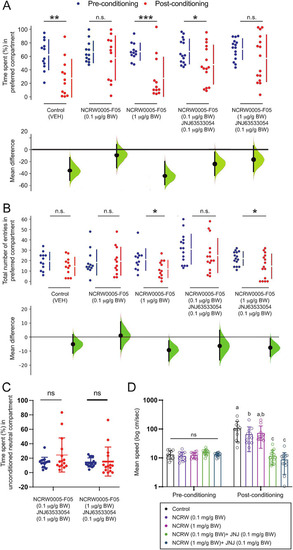
Effect of the GPR139 antagonist and co-treatment of the GPR139 antagonist and agonist on fear memory recall and avoidance. (A) During the post-conditioning (red dots), the time spent in the AS-paired compartment (originally preferred) was significantly reduced in vehicle control (1% DMSO, p = 0.0028, Cohen’s d = 1.1433, n = 12), fish treated with 1 μg/g BW of GPR139 antagonist (p = 0.0004, Cohen’s d = 1.4600, n = 12), and fish co-treated with 0.1 μg/g BW GPR139 antagonist and 0.1 μg/g BW agonist (p = 0.036, Cohen’s d = 0.7042, n = 15) as compared to pre-conditioning period (blue dots), indicating successful development of conditioned place avoidance, which was not seen in fish treated with 0.1 μg/g BW of GPR139 antagonist (p = 0.409, Cohen’s d = 0.2994, n = 12) and co-treated with 1 μg/g BW GPR139 antagonist and 0.1 μg/g BW GPR139 agonist (p = 0.173, Cohen’s d = 0.4485, n = 15). (B) There was a reduction in the number of entries to the conditioned compartment in fish treated with 1 μg/g BW of GPR139 antagonist (p = 0.0208, Cohen’s d = 0.8639, n = 12) and co-treated with 1 μg/g BW of antagonist and GPR139 agonist (p = 0.013, Cohen’s d = 0.740, n = 15) during the post-conditioning but not in the vehicle control (p = 0.152, Cohen’s d = 0.4790, n = 12), fish treated with 0.1 μg/g BW of GPR139 antagonist (p = 0.801, Cohen’s d = 0.1099, n = 12), and co-treated with GPR139 agonist and 0.1 μg/g BW of antagonist (p = 0.791, Cohen’s d = 0.403, n = 15). (C) During the pre- and post-conditioning phases, there was no significant difference in time spent within the neutral compartment in fish co-treated with 0.1 μg/g BW GPR139 antagonist and 0.1 μg/g BW GPR139 agonist and fish co-treated with 1 μg/g BW GPR139 antagonist and 0.1 μg/g BW GPR139 agonist. (D) Swimming speed was significantly reduced in both the co-treated groups (p < 0.0001) as compared to control or the fish treated with GPR139 antagonist alone. All behavioral data were analyzed using the Estimation Statistics Beta and the Statistical Package for the Social Sciences (SPSS, Version 24, IBM). All behavioral endpoint data were expressed as mean ± standard error of the mean (S.E.M.) and were compared using Student’s t-test, multi-two-group Cumming plot, one-way and two-way ANOVA, and Tukey’s test. *p < 0.05; **p < 0.01; ***p < 0.001; ns, not significant.

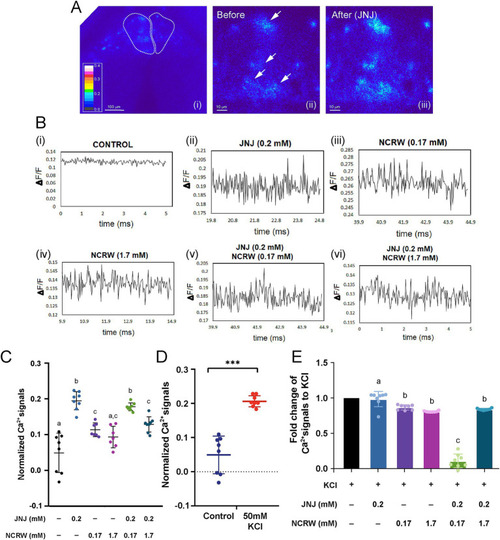
GPR139 regulates habenula neurons in acute brain slices. (A) Calcium imaging of habenula neurons in response to GPR139 compound. (B) Traces correspond to the cells upon (i) no treatment, (ii) 0.2 mM JNJ-63533054, (iii) 0.17 mM NCRW005-F05, (iv) 1.7 mM NCRW005-F05, (v) 0.2 mM JNJ-63533054 + 0.17 mM NCRW005-F05, and (vi) 0.2 mM JNJ-63533054 + 1.7 mM NCRW005-F05. (C) Average peak calcium signal in the habenula in presence of GPR139 agonist and antagonist treatment (control, average dF/F = 0.04892, n = 8; JNJ-63533054, average dF/F = 0.1948, n = 8, Cohen’s d = 1.6969; control, average dF/F = 0.04892, n = 8; 0.17 mM NCRW005-F05, average dF/F = 0.1135, n = 8, Cohen’s d = 1.2250; control, average dF/F = 0.04892, n = 8; 1.7 mM NCRW005-F05, average dF/F = 0.09326, n = 8, Cohen’s d = 0.9005; control, average dF/F = 0.04892, n = 8; 0.17 mM NCRW005-F05 + JNJ-63533054, average dF/F = 0.1778, n = 8, Cohen’s d = 1.9527; control, average dF/F = 0.04892, n = 8; 1.7 mM NCRW005-F05 + JNJ-63533054, average dF/F = 0.1288, n = 8, Cohen’s d = 1.3711). (D) Quantification of normalized calcium signal in habenula neurons shows a large increase in dF/F following bath application of 50 mM KCl (p < 0.0001, Cohen’s d = 2.2414). (E) Quantification indicates that there is a significant reduction in fold change in KCl-primed calcium transient by co-treatment with GPR139 agonist and 0.17 mM of GPR139 antagonist (p < 0.0001, R square = 0.9613). The spectrum for the pseudo-color representation in image (A) is used to represent calcium intensity. White arrows in images (A ii and iii) indicate habenula cells before and after GPR139 compound treatments. Scale bars: (A i), 100 μm; (A ii–iii), 10 μm. All reported results were expressed as mean ± standard error of the mean (S.E.M.) and were compared using unpaired Student’s t-test and one-way ANOVA. * p < 0.05; ** p < 0.01; *** p < 0.001; ns, not significant.

Acknowledgments
This image is the copyrighted work of the attributed author or publisher, and ZFIN has permission only to display this image to its users. Additional permissions should be obtained from the applicable author or publisher of the image. Full text @ Front. Neurosci.