IMAGE

Figure 2

ID
ZDB-IMAGE-250109-397
Source
Figures for Roy et al., 2024
Image
Figure Caption

Figure 2

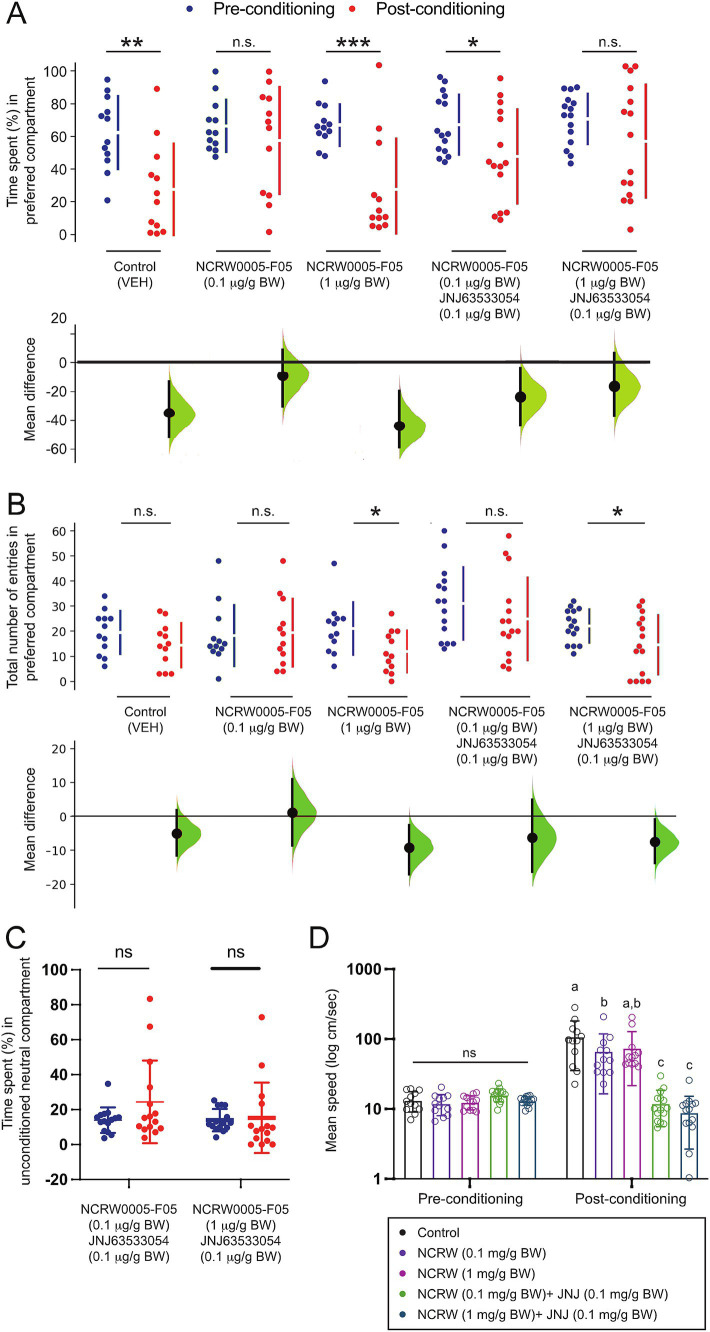
Effect of the GPR139 antagonist and co-treatment of the GPR139 antagonist and agonist on fear memory recall and avoidance. (A) During the post-conditioning (red dots), the time spent in the AS-paired compartment (originally preferred) was significantly reduced in vehicle control (1% DMSO, p = 0.0028, Cohen’s d = 1.1433, n = 12), fish treated with 1 μg/g BW of GPR139 antagonist (p = 0.0004, Cohen’s d = 1.4600, n = 12), and fish co-treated with 0.1 μg/g BW GPR139 antagonist and 0.1 μg/g BW agonist (p = 0.036, Cohen’s d = 0.7042, n = 15) as compared to pre-conditioning period (blue dots), indicating successful development of conditioned place avoidance, which was not seen in fish treated with 0.1 μg/g BW of GPR139 antagonist (p = 0.409, Cohen’s d = 0.2994, n = 12) and co-treated with 1 μg/g BW GPR139 antagonist and 0.1 μg/g BW GPR139 agonist (p = 0.173, Cohen’s d = 0.4485, n = 15). (B) There was a reduction in the number of entries to the conditioned compartment in fish treated with 1 μg/g BW of GPR139 antagonist (p = 0.0208, Cohen’s d = 0.8639, n = 12) and co-treated with 1 μg/g BW of antagonist and GPR139 agonist (p = 0.013, Cohen’s d = 0.740, n = 15) during the post-conditioning but not in the vehicle control (p = 0.152, Cohen’s d = 0.4790, n = 12), fish treated with 0.1 μg/g BW of GPR139 antagonist (p = 0.801, Cohen’s d = 0.1099, n = 12), and co-treated with GPR139 agonist and 0.1 μg/g BW of antagonist (p = 0.791, Cohen’s d = 0.403, n = 15). (C) During the pre- and post-conditioning phases, there was no significant difference in time spent within the neutral compartment in fish co-treated with 0.1 μg/g BW GPR139 antagonist and 0.1 μg/g BW GPR139 agonist and fish co-treated with 1 μg/g BW GPR139 antagonist and 0.1 μg/g BW GPR139 agonist. (D) Swimming speed was significantly reduced in both the co-treated groups (p < 0.0001) as compared to control or the fish treated with GPR139 antagonist alone. All behavioral data were analyzed using the Estimation Statistics Beta and the Statistical Package for the Social Sciences (SPSS, Version 24, IBM). All behavioral endpoint data were expressed as mean ± standard error of the mean (S.E.M.) and were compared using Student’s t-test, multi-two-group Cumming plot, one-way and two-way ANOVA, and Tukey’s test. *p < 0.05; **p < 0.01; ***p < 0.001; ns, not significant.

Acknowledgments
This image is the copyrighted work of the attributed author or publisher, and ZFIN has permission only to display this image to its users. Additional permissions should be obtained from the applicable author or publisher of the image. Full text @ Front. Neurosci.