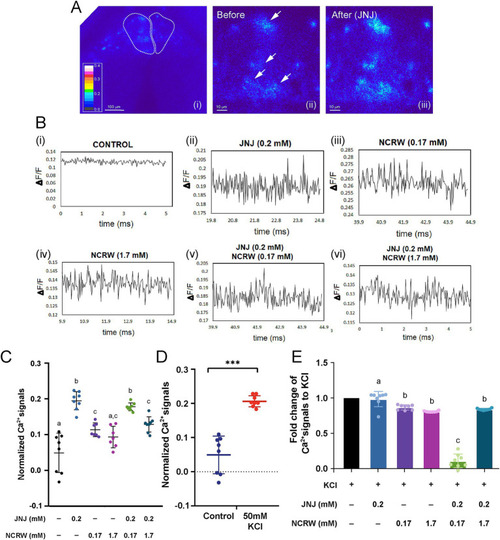
GPR139 regulates habenula neurons in acute brain slices. (A) Calcium imaging of habenula neurons in response to GPR139 compound. (B) Traces correspond to the cells upon (i) no treatment, (ii) 0.2 mM JNJ-63533054, (iii) 0.17 mM NCRW005-F05, (iv) 1.7 mM NCRW005-F05, (v) 0.2 mM JNJ-63533054 + 0.17 mM NCRW005-F05, and (vi) 0.2 mM JNJ-63533054 + 1.7 mM NCRW005-F05. (C) Average peak calcium signal in the habenula in presence of GPR139 agonist and antagonist treatment (control, average dF/F = 0.04892, n = 8; JNJ-63533054, average dF/F = 0.1948, n = 8, Cohen’s d = 1.6969; control, average dF/F = 0.04892, n = 8; 0.17 mM NCRW005-F05, average dF/F = 0.1135, n = 8, Cohen’s d = 1.2250; control, average dF/F = 0.04892, n = 8; 1.7 mM NCRW005-F05, average dF/F = 0.09326, n = 8, Cohen’s d = 0.9005; control, average dF/F = 0.04892, n = 8; 0.17 mM NCRW005-F05 + JNJ-63533054, average dF/F = 0.1778, n = 8, Cohen’s d = 1.9527; control, average dF/F = 0.04892, n = 8; 1.7 mM NCRW005-F05 + JNJ-63533054, average dF/F = 0.1288, n = 8, Cohen’s d = 1.3711). (D) Quantification of normalized calcium signal in habenula neurons shows a large increase in dF/F following bath application of 50 mM KCl (p < 0.0001, Cohen’s d = 2.2414). (E) Quantification indicates that there is a significant reduction in fold change in KCl-primed calcium transient by co-treatment with GPR139 agonist and 0.17 mM of GPR139 antagonist (p < 0.0001, R square = 0.9613). The spectrum for the pseudo-color representation in image (A) is used to represent calcium intensity. White arrows in images (A ii and iii) indicate habenula cells before and after GPR139 compound treatments. Scale bars: (A i), 100 μm; (A ii–iii), 10 μm. All reported results were expressed as mean ± standard error of the mean (S.E.M.) and were compared using unpaired Student’s t-test and one-way ANOVA. * p < 0.05; ** p < 0.01; *** p < 0.001; ns, not significant.
|
