FIGURE SUMMARY
Title

Neuroblastoma-derived hypoxic extracellular vesicles promote metastatic dissemination in a zebrafish model

Authors
Fietta, A., Fusco, P., Germano, G., Micheli, S., Sorgato, M., Lucchetta, G., Cimetta, E.
Source
Full text @ PLoS One

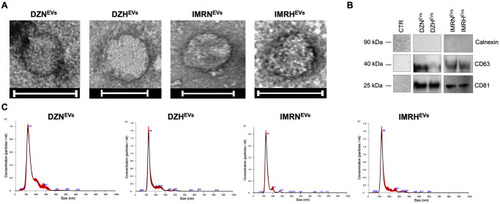
Characterization of EVs isolated from NB cells.

A. Representative images of EVs morphology taken by TEM. Scale bar: 100 nm. B. Validation of EVs markers CD63, CD81, and negative marker Calnexin expression by western blot analysis. Panels represent different blots. Fresh cell culture medium was considered as CTR. C. Size distribution profile of EVs analyzed by NTA.

EmbryoAligner design, production, and characterization.

A. 3D-CAD design of the master; dimensions in mm. B. Finished EmbryoAligner aluminum mold and PDMS replica. C. Selected areas of interest for the metrological analyses. D. Metrological characterization of the tail height. Comparisons between master mold and PDMS replicas measured in the highlighted areas of interest A-C. CAD reference value was 0.12 mm. E. Metrological characterization of the body height. Comparisons between master mold and PDMS replicas measured in the highlighted areas of interest 1–4. CAD reference values were 0.12 mm for the region 1–2 and 0.24 mm for 1–4. D. and E. are box mean bars with square error.

Internalization of NB-derived EVs by endothelial cells.

A-B. Injection site, imaging site, and timeline for the transgenic line Tg(fli1:EGFP) injected with labeled NB-derived EVs (red) at 48 hpf. The CHT was imaged after 6 hours to evaluate internalization by endothelial cells (green). C. Representative 6 hpi CHT images of internalized EVs derived from each cell line and oxygenation condition as indicated. Scale bars 50 μm. D. Higher magnification images in selected areas. White arrows indicate overlapping areas (yellow) of labeled EVs (red) internalized by endothelial cells (green). Scale bars 10 μm. E. Evaluation of internalization of labeled EVs by endothelial cells via ImageJ software. n = 88 from at least 3 independent experiments. *** p < 0.001.

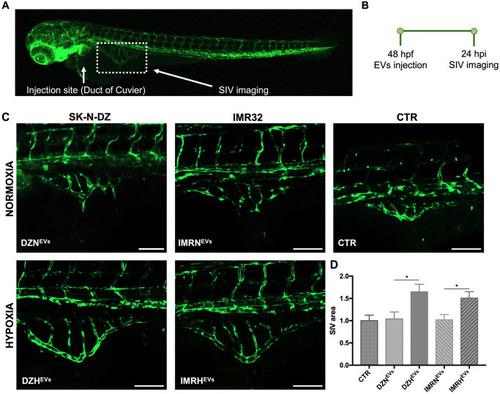
Effects of NB-derived EVs on angiogenesis.

A-B. Injection site, imaging site, and timeline for the transgenic line Tg(fli1:EGFP) injected with NB-derived EVs at 48 hpf. C. SIVs were imaged 24 hpi to evaluate the sprouting of vessels. SIVs areas analyzed are highlighted by white dotted lines. Scale bars 100 μm. D. Evaluation of SIVs area via ImageJ software. n = 137 from at least 3 independent experiments. * p < 0.05.

Hypoxic NB-derived EVs promote macrophages mobilization.

A-B. Injection site, imaging site, and timeline for the transgenic line Tg(mpeg1:mCherry) injected with NB-derived EVs at 48 hpf. C. Representative image of labeled EVs (green, white arrows) internalized by macrophages (red). Scale bar 20 μm. D. Macrophages mobilization in the CHT 6 hpi. Scale bars 100 μm. E. Evaluation of macrophages area via ImageJ software. n = 125 from at least 2 independent experiments. * p < 0.05.

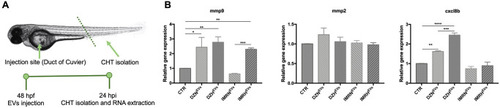
Hypoxic EVs influence the expression of mmp9 and cxcl8b in the CHT.

A. Injection site, analysis site, and timeline for Casper embryos injected with NB-derived EVs. B. Relative mRNA expression for mmp9, mmp2 and cxcl8b measured by qPCR in CHT tissues 24 hours after EVs injection. Data are represented as 2-ΔΔCt, β-Actin was used as housekeeping gene. n = 450 from at least 3 independent experiments. * p < 0.05, ** p < 0.01, *** p < 0.001, **** p < 0.0001.

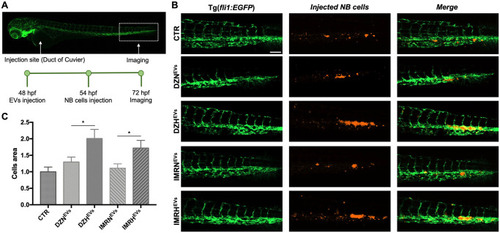
Hypoxic EVs promote the proliferation of NB cells in the CHT.

A. Injection site, analysis site, and timeline for Tg(fli1:EGFP) embryos injected with NB-derived EVs and NB cells. Embryos were injected with EVs isolated from SK-N-DZ or IMR32 cells cultured in normoxic or hypoxic conditions, and subsequently injected with SK-N-DZ and IMR32 cells, respectively. B. Representative CHT images 24 hpi of EVs and 18 hpi of SK-N-DZ cells (orange). Scale bar 100 μm. C. Representative CHT images 24 hpi of EVs and 18 hpi of IMR32 cells (orange). Scale bar 100 μm. D. Evaluation of proliferated SK-N-DZ cells area in the CHT at 72 hpf. n = 53 from at least 3 independent experiments. * p < 0.05. E. Evaluation of proliferated IMR32 cells area in the CHT at 72 hpf. n = 59 from at least 3 independent experiments. * p < 0.05.

Acknowledgments
This image is the copyrighted work of the attributed author or publisher, and ZFIN has permission only to display this image to its users. Additional permissions should be obtained from the applicable author or publisher of the image. Full text @ PLoS One