FIGURE SUMMARY
Title

Endothelial tip-cell position, filopodia formation and biomechanics require BMPR2 expression and signaling

Authors
Hiepen, C., Benamar, M., Barrasa-Fano, J., Condor, M., Ilhan, M., Münch, J., Hastar, N., Kerkhoff, Y., Harms, G.S., Mielke, T., Koenig, B., Block, S., Rocks, O., Abdelilah-Seyfried, S., Van Oosterwyck, H., Knaus, P.
Source
Full text @ Commun Biol

BMPR2 is required for CVP sprouting angiogenesis and EC filopodia formation, contributing to the endothelial tip cell phenotype.

a Zebrafish embryo expressing the endothelial Tg(kdrl-GFP) reporter transgene and maximum projection images of the caudal vein plexus (CVP) at 25 h post fertilization (hpf) from control or bmpr2b MO-treated embryos (upper) and control or bmpr2b crispant-treated embryos (lower) (arrows indicate individual tip cells). Scale bar: 50 µm. Right, close-up of regions (I and II) of interest depicted in bmpr2b MO-treated embryos (upper) and close-up of regions (III and IV) of interest depicted in bmpr2b crispant-treated embryos (lower) (arrows indicate individual filopodia at tip cell). b Quantification of the number of protruding cells at the CVP of control or bmpr2b MO-treated zebrafish and control or bmpr2b crispant-treated zebrafish at 25hpf. ***p < 0.001. c Representative images of optical sections showing part of the caudal vein plexus (CVP) in Tg(kdrl:GFP) endothelial reporter embryos. In control embryos, CD34 is present in many cells along the front of the CVP (yellow asterisks) whereas in bmpr2b-crispants most of the cells lack CD34 (indicated by white asterisks). Scale bar: 10 µm. Quantification of CD34+/ GFP+ cells in comparison to GFP+ cells in the CVP from Tg(kdrl:GFP) endothelial reporter embryos. ***p < 0.005. d Scheme describing formation of leader cells by gap closure assay using silicone-inserts. Cells are seeded in a silicone-insert on a glass coverslip. After cell-adherence, the silicone-insert is removed creating a cell-free gap towards which the first rows of cells polarize and migrate. Samples are then fixed and treated for immunofluorescence staining. e Immunofluorescence pictures of control and BMPR2+/- ECs, Phalloidin (magenta), DAPI (blue) (top). Scanning-Electron Micrographs (SEM) of control and BMPR2+/– ECs (bottom). Inlets show regions of interest. Respective quantifications of the number of filopodia per 100 µm of cell edge for immunofluorescence (upper) and SEM (lower) analysis are shown on the right. *p < 0.05; ***p < 0.001. Scale bar: 10 µm. f Immunofluorescence staining of HUVECs transfected with FITC-labeled control siRNA (siControl) or a 1:1 mix of FITC-labeled control siRNA and BMPR2-targeting siRNA (siBMPR2). Phalloidin (magenta), DAPI (blue), FITC (green). Inlets show regions of interest. Quantification of the number of filopodia per 100 µm of cell edge is shown below. ***p < 0.001. Scale bar: 20 µm. g Immunofluorescence staining of BMPR2+/- ECs overexpressing GFP control (upper) or BMPR2-GFP for filopodia rescue (lower). Phalloidin (magenta), DAPI (blue), GFP (green). Insets show regions of interest. Quantification of the number of filopodia per 100 µm of cell edge is shown on the right. ***p < 0.001. Scale bar: 20 µm. h Single particle trajectories of individual BMPR2 molecules. Trajectories were recorded by Total Internal Reflection Fluorescence (TIRF) microscopy. For this, BMPR2-HA was overexpressed in Cos7 cells and labeled with individual Quantum-Dots (Qdot). Trajectories were recorded for 25 s and analyzed via tracking software. Trajectories were overlaid onto F-Actin signal (upon co-transfection of LifeAct-GFP) and color coded relative to their magnitude (immobile BMPR2: Blue; mobile BMPR2: Red). Arrowheads indicate different BMPR2 mobilities across different cellular sub-compartments (left). BMP2 induced confinement of BMPR2 (right): BMPR2 trajectories in Cos7 cells before (upper) and after stimulation with 3 nM BMP2 (lower). Reduction in diffusivity of individual BMPR2 molecules in µm2/sec is shown after stimulation with BMP2.

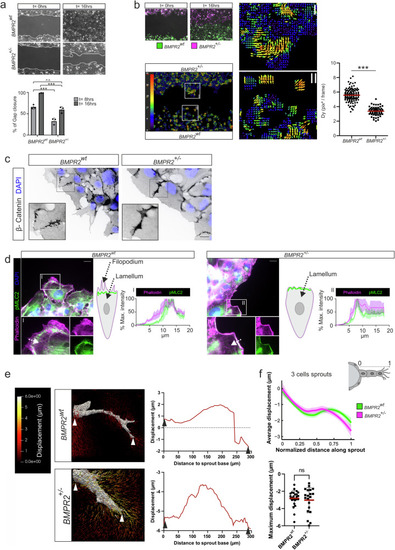
BMPR2 is required for polarized EC migration, regulates spatial actomyosin organization at the EC leading edge and organizes 3D pulling force distribution at the sprout front during angiogenic sprouting in fibrin ECM.

a Phase contrast pictures of gap closure at 16 h (upper) Scale bar: 100 µm: Quantification of gap closure for BMPR2wt or BMPR2+/– ECs at 8 h or 16 h after silicone insert removal. (lower) ***p < 0.001. b Images of wound healing assay with BMPR2wt ECs (green) and BMPR2+/– ECs (magenta) at 0 h or 16 h after silicone insert removal. BMPR2wt (bottom) ECs and BMPR2+/– (top) ECs were seeded separately in one compartment of the seeding insert. Scale bar: 100 µm. (middle) Particle image velocimetry analysis of trajectories from ECs used in gap closure assay on the (left). Vectors indicate the main direction and the magnitude of ECs displacements over time. Insets show regions of interest (I & II). (right) Quantification of EC displacement magnitude (Dy) measured by trajectory analysis for BMPR2wt ECs and BMPR2+/– ECs and expressed in pixel² per frame. ***p < 0.001. c Immunofluorescence staining of BMPR2wt ECs and BMPR2+/– ECs junctions. Beta-Catenin (black), DAPI (blue). Insets show regions of interest. Scale bar: 20 µm. d Immunofluorescence staining of BMPR2wt ECs and BMPR2+/– ECs: Phalloidin (magenta), DAPI (blue), phospho-Myosin Light Chain 2 (pMLC2) (green). Insets show regions of interest. Scale bar: 20 µm. Fluorescence intensity profiles of BMPR2wt ECs and BMPR2+/– ECs were measured along the direction of the arrows depicted (cell periphery towards inside of the cell) and averaged for 5 cells. Confidence bands represent standard deviation of the mean. Graphic representation of observed phalloidin and pMLC2 localization at the leading edge for BMPR2wt ECs and BMPR2+/– ECs. The corresponding locations of EC Filopodia and Lamellum at the polarized cells leading edge are indicated (arrows); F-actin (magenta), contractile actomyosin (green). e (left) Absolute hydrogel displacement fields for BMPR2wt or BMPR2+/– sprouts. The displacement field magnitude is indicated by color coding (left). (right) Displacement line scans along individual sprouts showing displacements in µm from sprout origin to tip. Negative values correspond to ECM displacements towards the sprout origin. f (upper) Average displacements measured along sprouts of similar length (3 cells) for BMPR2wt ECs and BMPR2+/– ECs. The length of each sprout was normalized from 0 (base of the sprout) to 1 (tip of the sprout) to make them comparable. (below) Maximum displacements measured for individual sprouts for BMPR2wt ECs and BMPR2+/– ECs.

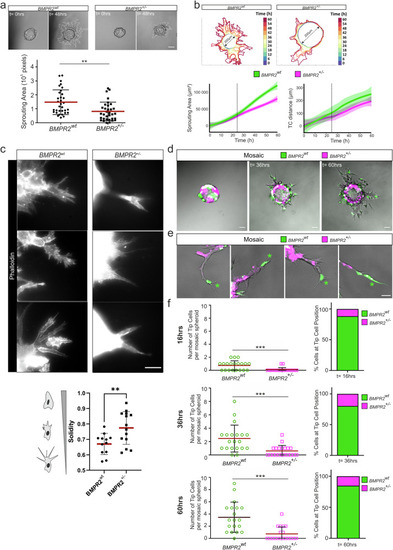
BMPR2 is required for efficient sprouting and tip cell (TC) position in 3D spheroid assays.

a BMPR2wt ECs and BMPR2+/– ECs were seeded to coat microcarrier beads, embedded in fibrin gel and covered with EC activation medium for sprouting. Dotted line indicates sprouting area as measured for quantification. Sprouting area after 48 h was measured in pixel with ImageJ and quantified. **p < 0.01. Scale bar: 100 µm. b Visualization and quantification of ECs sprouting kinetics over 60h. The sprouting area of EC spheroids from BMPR2wt ECs and BMPR2+/– ECs at each time point was represented using a heatmap color coding. (time intervals = 6 h). Plots represents average normalized sprouting area over time for each condition (left) and the average migration distance of the tip cell from the surface of the spheroid over time for each condition (right). Standard deviation of the data was represented as confidence bands around the curves. Dotted lines indicate the 24 h time point. c Representative immunofluorescence images of 3D sprout ends from BMPR2wt ECs and BMPR2+/– ECs stained with phalloidin (white) after 64 h of sprouting. Cell morphology and protrusions were assessed by segmenting and measuring the solidity of several tip cells. Scale bar: 50 µm. d Mosaic spheroids with BMPR2wt ECs (green) and BMPR2+/– ECs (magenta) were seeded in fibrin for sprouting and imaged at 12 h, 36 h, and 60 h after embedding. Scale bar: 100 µm. e Mosaic magnified sprouts with BMPR2wt TCs (green) and BMPR2+/- SCs (magenta) upon 60 h of sprouting. Asterisks indicate position of tip cell. Scale bar: 50 µm. f The number of BMPR2wt TCs (green) and BMPR2+/– TCs (magenta) and their relative proportion were quantified for time points 16 h, 36 h and 60 h of sprouting. ***p < 0.001.

BMPR2 promotes CDC42 activity at the plasma membrane of ECs via the PI3K-CDC42 signaling axis.

a Immunofluorescence staining of BMPR2wt ECs overexpressing HA-tagged BMPR2 (BMPR2-HA). Phalloidin (white), DAPI (blue), BMPR2-HA (green), CDC42 (magenta). Insets show regions of interest. Arrows indicate sites of colocalization between BMPR2-HA and CDC42 at cell cortex or in filopodia compartment base and shaft. Scale bar: 10 µm. b Heat-map showing FRET-measured CDC42 activity across whole areas of BMPR2wt ECs (left) and BMPR2+/- ECs (right). Insets show regions of interest. Quantification of FRET signal from depicted TFP-WASP-Venus-CDC42 construct in BMPR2wt ECs and BMPR2+/- ECs (right). ***p < 0.001. c Immunofluorescence staining of BMPR2+/- ECs overexpressing GFP or a constitutively active CDC42 in fusion with GFP (C.A-CDC42-GFP) and quantification of the number of filopodia per 100 µm of cell edge (right). Phalloidin (magenta), DAPI (blue), GFP (green). Insets show regions of interest. **p < 0.01. Scale bar: 20 µm. d Immunoblot against CDC42 and GAPDH from BMPR2wt ECs and BMPR2+/- ECs cultured in EC activation medium containing 20% Serum and pro-angiogenic growth factors. e Immunoblot against pAKT-Ser473 (S473), pAKT-Thr308 (T308), total AKT (tAKT) and GAPDH from BMPR2wt ECs or BMPR2+/– ECs treated with either DMSO, 10 µM LY294002 or 10 µM UCL-TRO-1938 for 60 min in EC activation medium containing 20 % Serum and pro-angiogenic growth factors. f Quantifications of the number of filopodia per 100 µm cell edge of BMPR2wt ECs or BMPR2+/– ECs treated with either DMSO, 10 µM LY294002 or 10 µM UCL-TRO-1938 for 60 min in EC activation medium. *p < 0.05, ***p < 0.001. g Spinning disk microscopy images of BMPR2wt ECs or BMPR2+/– ECs expressing dTomato-WASp(CRIB) active CDC42 biosensor, and co-expressing either GFP or BMPR2-GFP for BMPR2+/– ECs. Scheme depicts the mechanism of action of the CDC42 activity biosensor: Upon activation by PIP3-anchored GEFs, CDC42 is enriched at the plasma membrane and can be bound by dTomato-WASp(CRIB) biosensor, promoting relocation and local enrichment of the fluorescent biosensor. Relocation of the dTomato–WASp(CRIB) biosensor was measured by quantifying the ratio of the sensor membranous intensity over its cytosolic intensity. Arrowheads indicate sites of enrichment of the biosensor at the plasma membrane. Scale bar: 20 µm. *p < 0.05, ****p < 0.0001.

Graphical summary.

Endothelial cells form filopodia to sense their environments and facilitate chemotaxis-induced migration. In 2D migration assays, BMPR2-deficient cells fail to form filopodia and display an exacerbated collective migration behavior upon lack of BMPR2 expression which impedes with their efficient forward movement. We also found an increased co-localization of actomyosin together with cortical actin at the leading edge of BMPR2 deficient cells. Also, focal adhesion formation is altered. In 3D sprouting assays, BMPR2 deficiency stalls sprouting and abrogates ECs from acquiring the tip cell (TC) position. Wildtype and BMPR2 deficient sprouts perform pulling which is dominated by the tip-cell (TC), while we find no general change in overall pulling forces between BMPR2wt and BMPR2+/- sprouts. In spheroid sprouting assays as mosaic, loss of BMPR2 expression by the TC identifies BMPR2 as a gene required for acquiring TC position in competition with stalk cells (SCs). In our proposed molecular model, we identified BMPR2 to regulates CDC42 activity. We propose that CDC42 dependent actin polymerization is facilitated in proximity to filopodia by ref. 1 inducing non- canonical PI3K signaling and2 via yet to be confirmed BMPR2 interacting CDC42 effector protein BORG5, known to promote local actomyosin contractility in ECs.

Acknowledgments
This image is the copyrighted work of the attributed author or publisher, and ZFIN has permission only to display this image to its users. Additional permissions should be obtained from the applicable author or publisher of the image. Full text @ Commun Biol