IMAGE

Fig. 2

ID
ZDB-IMAGE-250110-73
Source
Figures for Hiepen et al., 2025
Image
Figure Caption

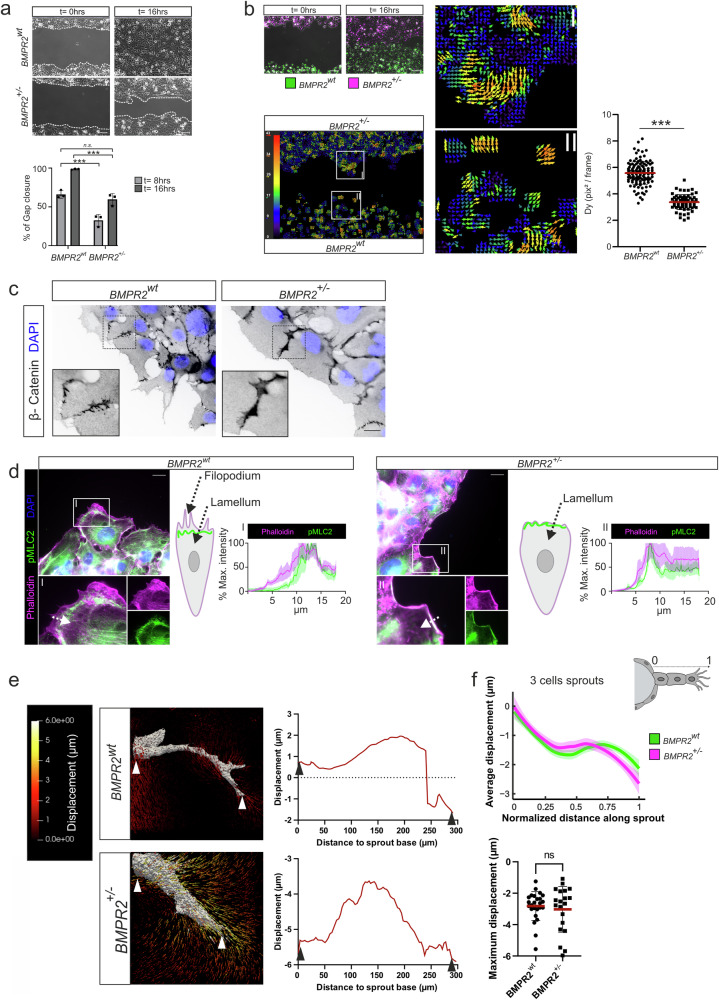
Fig. 2 BMPR2 is required for polarized EC migration, regulates spatial actomyosin organization at the EC leading edge and organizes 3D pulling force distribution at the sprout front during angiogenic sprouting in fibrin ECM.

a Phase contrast pictures of gap closure at 16 h (upper) Scale bar: 100 µm: Quantification of gap closure for BMPR2wt or BMPR2+/– ECs at 8 h or 16 h after silicone insert removal. (lower) ***p < 0.001. b Images of wound healing assay with BMPR2wt ECs (green) and BMPR2+/– ECs (magenta) at 0 h or 16 h after silicone insert removal. BMPR2wt (bottom) ECs and BMPR2+/– (top) ECs were seeded separately in one compartment of the seeding insert. Scale bar: 100 µm. (middle) Particle image velocimetry analysis of trajectories from ECs used in gap closure assay on the (left). Vectors indicate the main direction and the magnitude of ECs displacements over time. Insets show regions of interest (I & II). (right) Quantification of EC displacement magnitude (Dy) measured by trajectory analysis for BMPR2wt ECs and BMPR2+/– ECs and expressed in pixel² per frame. ***p < 0.001. c Immunofluorescence staining of BMPR2wt ECs and BMPR2+/– ECs junctions. Beta-Catenin (black), DAPI (blue). Insets show regions of interest. Scale bar: 20 µm. d Immunofluorescence staining of BMPR2wt ECs and BMPR2+/– ECs: Phalloidin (magenta), DAPI (blue), phospho-Myosin Light Chain 2 (pMLC2) (green). Insets show regions of interest. Scale bar: 20 µm. Fluorescence intensity profiles of BMPR2wt ECs and BMPR2+/– ECs were measured along the direction of the arrows depicted (cell periphery towards inside of the cell) and averaged for 5 cells. Confidence bands represent standard deviation of the mean. Graphic representation of observed phalloidin and pMLC2 localization at the leading edge for BMPR2wt ECs and BMPR2+/– ECs. The corresponding locations of EC Filopodia and Lamellum at the polarized cells leading edge are indicated (arrows); F-actin (magenta), contractile actomyosin (green). e (left) Absolute hydrogel displacement fields for BMPR2wt or BMPR2+/– sprouts. The displacement field magnitude is indicated by color coding (left). (right) Displacement line scans along individual sprouts showing displacements in µm from sprout origin to tip. Negative values correspond to ECM displacements towards the sprout origin. f (upper) Average displacements measured along sprouts of similar length (3 cells) for BMPR2wt ECs and BMPR2+/– ECs. The length of each sprout was normalized from 0 (base of the sprout) to 1 (tip of the sprout) to make them comparable. (below) Maximum displacements measured for individual sprouts for BMPR2wt ECs and BMPR2+/– ECs.

Acknowledgments
This image is the copyrighted work of the attributed author or publisher, and ZFIN has permission only to display this image to its users. Additional permissions should be obtained from the applicable author or publisher of the image. Full text @ Commun Biol