|
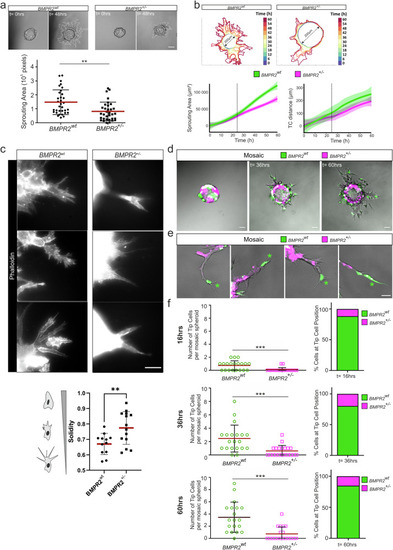
BMPR2 is required for efficient sprouting and tip cell (TC) position in 3D spheroid assays. a BMPR2wt ECs and BMPR2+/– ECs were seeded to coat microcarrier beads, embedded in fibrin gel and covered with EC activation medium for sprouting. Dotted line indicates sprouting area as measured for quantification. Sprouting area after 48 h was measured in pixel with ImageJ and quantified. **p < 0.01. Scale bar: 100 µm. b Visualization and quantification of ECs sprouting kinetics over 60h. The sprouting area of EC spheroids from BMPR2wt ECs and BMPR2+/– ECs at each time point was represented using a heatmap color coding. (time intervals = 6 h). Plots represents average normalized sprouting area over time for each condition (left) and the average migration distance of the tip cell from the surface of the spheroid over time for each condition (right). Standard deviation of the data was represented as confidence bands around the curves. Dotted lines indicate the 24 h time point. c Representative immunofluorescence images of 3D sprout ends from BMPR2wt ECs and BMPR2+/– ECs stained with phalloidin (white) after 64 h of sprouting. Cell morphology and protrusions were assessed by segmenting and measuring the solidity of several tip cells. Scale bar: 50 µm. d Mosaic spheroids with BMPR2wt ECs (green) and BMPR2+/– ECs (magenta) were seeded in fibrin for sprouting and imaged at 12 h, 36 h, and 60 h after embedding. Scale bar: 100 µm. e Mosaic magnified sprouts with BMPR2wt TCs (green) and BMPR2+/- SCs (magenta) upon 60 h of sprouting. Asterisks indicate position of tip cell. Scale bar: 50 µm. f The number of BMPR2wt TCs (green) and BMPR2+/– TCs (magenta) and their relative proportion were quantified for time points 16 h, 36 h and 60 h of sprouting. ***p < 0.001.
|