
- Title
-
Exploring the Antimycobacterial Potential of Podocarpusflavone A from Kielmeyera membranacea: In Vitro and In Vivo Insights
- Authors
- Araujo, M.H., Muñoz Sánchez, S., Simão, T.L.B.V., Nowik, N., Antunes, S.S., Pinto, S.C., Sorze, D., Boldrin, F., Manganelli, R., Correia Romeiro, N., Lasunskaia, E.B., Verbeek, F.J., Spaink, H.P., Muzitano, M.F.
- Source
- Full text @ Pharmaceuticals (Basel)

UPLC-MS/MS (254 nm) chromatogram, UV, and MS spectra of the F5 and F6 subfractions purified from dichloromethane fraction (DCM) of |
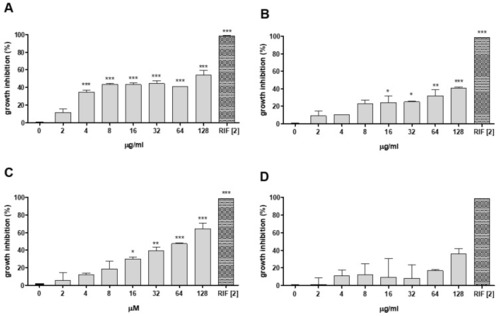
Growth inhibition of |

Growth inhibition of |

Effect of podocarpusflavone A (PCFA), isoniazid (INH), and INH-PCFA combinations on |
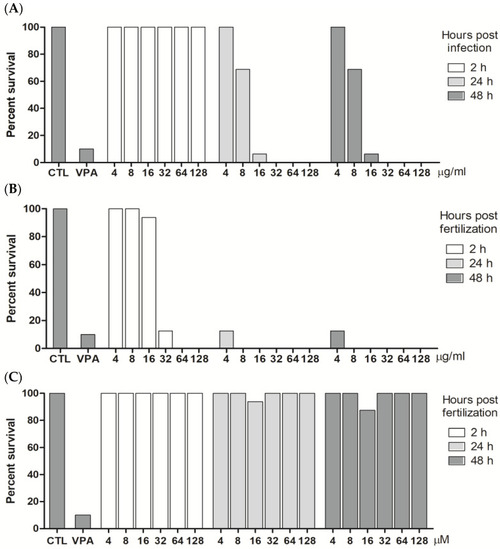
Viability of zebrafish larvae treated with |
Effect of treatment with the ethanolic extract (EE), dichloromethane fraction (DCM) (32 µg/mL), and podocarpusflavone A (PCFA) (32 µM) on mycobacterial growth (mCherry E11) in 4- and 5-day-old Tg(mpeg1:eGFP)gl22 larvae after yolk sac injection of |
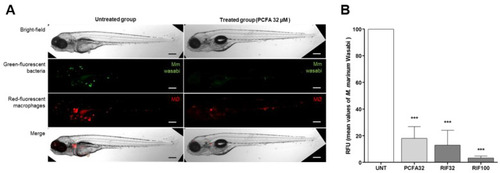
Caudal vein injection of |
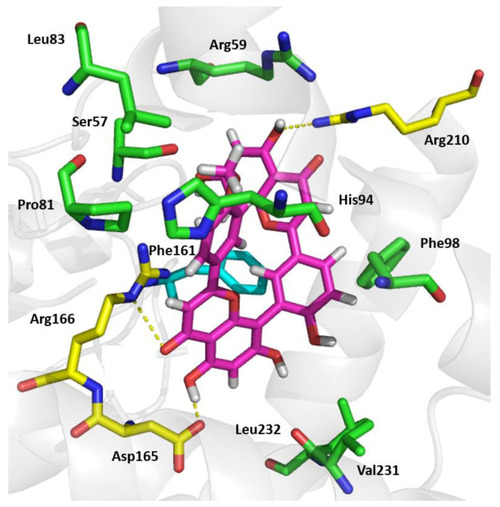
Molecular docking of podocarpusflavone A (PCFA) and PtpB of |

Amino acid sequence alignment of PtpB of |

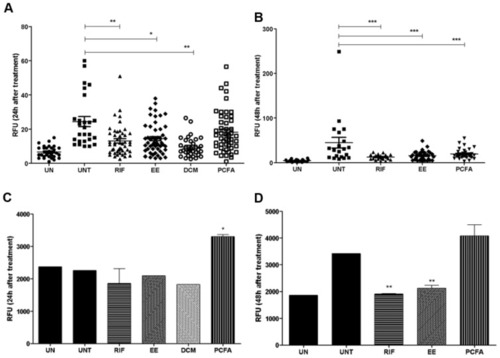
Expression levels of cytokines and macrophage markers in zebrafish larvae infected with |