
- Title
-
Translation of zinc finger domains induces ribosome collision and Znf598-dependent mRNA decay in zebrafish
- Authors
- Ishibashi, K., Shichino, Y., Han, P., Wakabayashi, K., Mito, M., Inada, T., Kimura, S., Iwasaki, S., Mishima, Y.
- Source
- Full text @ PLoS Biol.
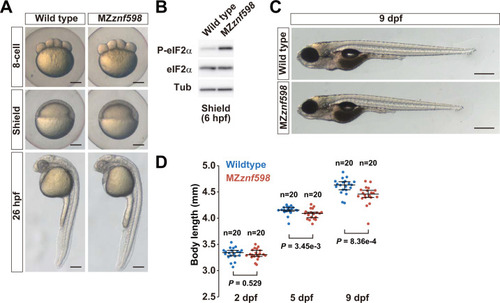
Analysis of zebrafish MZ (A) Brightfield images of wild-type and MZ |
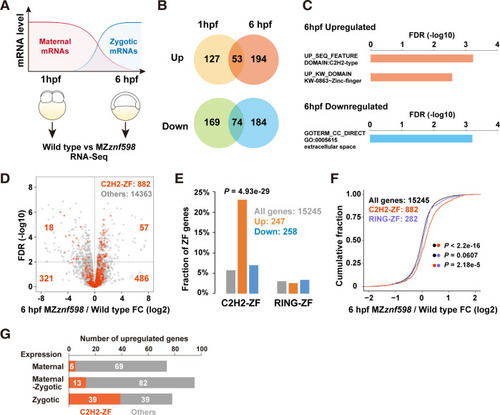
Transcriptome analysis of MZ (A) A scheme of RNA-Seq analysis comparing wild-type and MZ |
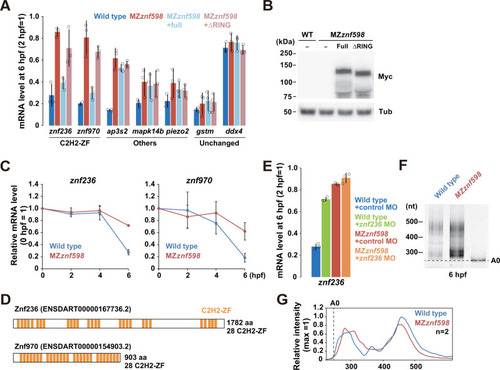
Validation of maternal mRNAs up-regulated in MZ (A) qRT-PCR analysis of maternal NGD target candidate mRNAs in wild-type (blue) and MZ |
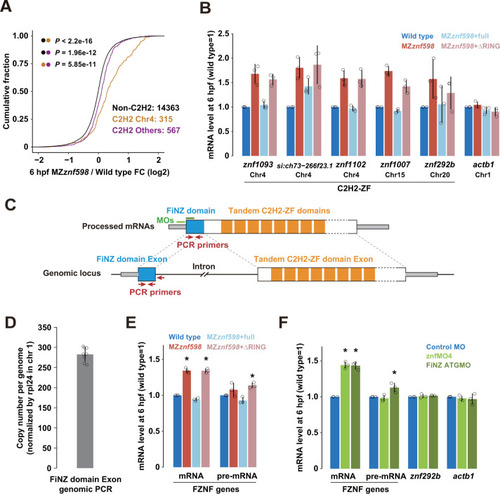
Validation of zygotic C2H2-ZF mRNAs up-regulated in MZ (A) Cumulative distributions of fold changes in mRNA levels in MZ |
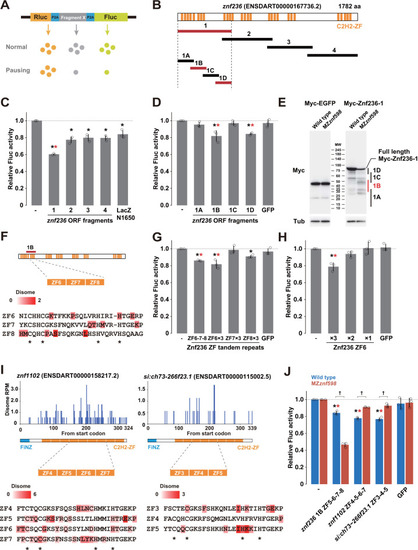
Analysis of ribosome stalling sequences in C2H2-ZF mRNAs. (A) A schematic of the tandem ORF assay. The Rluc ORF (orange) and Fluc ORF (light green) are separated by 2 P2A translation skipping sequences (blue). The sequence to be tested (shown as X in gray) is inserted between the 2 P2A sequences. (B) Schematic of the |

Analysis of the effect of C2H2-ZF sequences on mRNA stability. (A) A scheme of the mRNA injection assay used to measure the effect of the sequence to be tested (shown as X in gray) on mRNA stability. (B) qRT-PCR analysis of injected sfGFP reporter mRNAs at 6 hpf relative to 2 hpf in wild-type (blue) and MZ |