IMAGE

Fig 5

ID
ZDB-IMAGE-241207-5
Source
Figures for Ishibashi et al., 2024
Image
Figure Caption

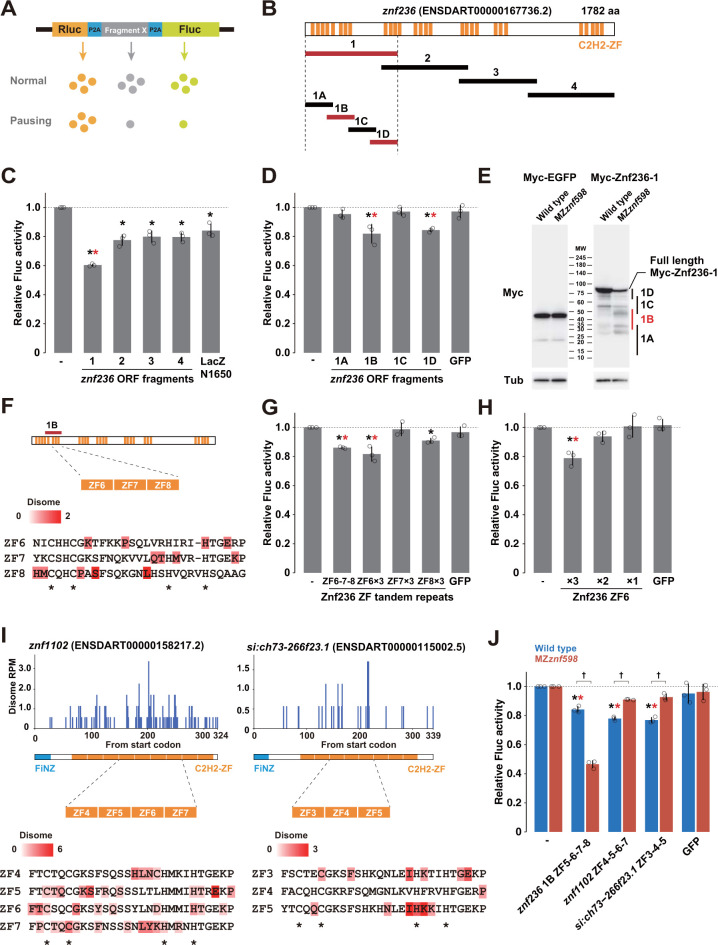
Fig 5 Analysis of ribosome stalling sequences in C2H2-ZF mRNAs.

(A) A schematic of the tandem ORF assay. The Rluc ORF (orange) and Fluc ORF (light green) are separated by 2 P2A translation skipping sequences (blue). The sequence to be tested (shown as X in gray) is inserted between the 2 P2A sequences. (B) Schematic of the znf236 ORF fragments analyzed in this study. C2H2-ZF is indicated in orange. Fragments that caused significant ribosome stalling in the tandem luciferase assay are indicated in red. (C, D) Results of the tandem ORF assay with the znf236 fragment. (E) Western blotting to detect Myc-tagged EGFP (left panel) or Myc-tagged Znf236 fragment 1 in the wild type and MZznf598 at 6 hpf. Tubulin (Tub) was detected as a loading control. The predicted positions of Myc-tagged peptides truncated in the Znf236 1A-1D regions are indicated on the right. (F) A detail of the 1B fragment. The amino acid sequences of ZF6, ZF7, and ZF8 are shown below. A-site positions of the stalled leading ribosome and corresponding footprint amounts are indicated as a red gradient. (G) Results of the tandem ORF assay with ZF6, ZF7, or ZF8 repeats. (H) Results of the tandem ORF assay with different numbers of ZF6 repeats. (I) Distributions of disome footprints (blue) in the znf1102 and si:ch73-266f23.1 ORFs. The amino acid sequences of C2H2-ZFs with high disome footprint amounts are shown below. A-site positions of the stalled leading ribosome and corresponding footprint amounts are indicated as a red gradient. (J) Results of the tandem ORF assay with 1B fragment (ZF5-6-7-8) of znf236, ZF4-5-6-7 of znf1102, and ZF3-4-5 of si:ch73-266f23.1 in wild-type (blue) and MZznf598 (red) embryos. The graphs in C, D, G, H, and J represent the average of 3 independent experiments. Relative Fluc signals normalized to Rluc signals are shown. Values with no insert (-) were set to one. The error bars show the standard deviation. The open circles show each data point. Black asterisks indicate p < 0.05 compared to no insert. Red asterisks indicate p < 0.05 compared to LacZ-N1650 or GFP (Dunnett’s test). Daggers indicate p < 0.05 (Student’s t test). The numerical data underlying this figure can be found in S1 Data. hpf, hours postfertilization.

Acknowledgments
This image is the copyrighted work of the attributed author or publisher, and ZFIN has permission only to display this image to its users. Additional permissions should be obtained from the applicable author or publisher of the image. Full text @ PLoS Biol.