Gal4-UAS overexpression of FynY531F leads to autophosphorylation of Y416, trunk curvature and swimming defects. (A) Diagram of elavl3:Gal4; 14XUAS:fynY531F neural-specific model. (B) Western blot probed with anti-P-Y416-SFK antibody, showing elevated Y416 phosphorylation in 5 days post fertilization (dpf) elavl3:Gal4; 14XUAS:fynY531Fis89 and elavl3:Gal4; 14XUAS:fynY531Fis90 in comparison to wild-type +/+ larvae. Anti-β-actin antibody was used as a loading control. (C) Trunk curvature observed in a subset of 5 dpf elavl3:Gal4; 14XUAS:fynY531Fis90 larvae. Plot shows the percentages of 5 dpf wild-type +/+, elavl3:Gal4; 14XUAS:fynY531Fis89 and elavl3:Gal4; 14XUAS:fynY531Fis90 larvae showing trunk curvature. (D) Measurements of velocity (left) and distance moved (middle) in 5 dpf wild-type +/+ and elavl3:Gal4; 14XUAS:fynY531Fis90 larvae that showed normal trunk morphology. Circular plots (right) show 5 s snapshots of tracking movements. Normal movements (green lines) and large movements (red lines) are shown for a wild-type 5 dpf +/+ larva and an elavl3:Gal4; 14XUAS:fynY531Fis90 larva with normal trunk morphology. Scale bars: 500 µm.
Zebrafish neural FynY531F overexpression drives dopaminergic neuron loss and mitochondria accumulation. (A) Left: live confocal imaging of ventral diencephalon (vDC) neuron cluster eGFP dopaminergic neurons in 3 dpf and 5 dpf control dat:eGFP and elavl3:Gal4; UAS:fynY531F larvae. Top right: vDC in 5 dpf larval brain. Diagram adapted from Kalyn et al. (2019) and created with BioRender.com. Bottom right: quantification of vDC eGFP neuronal cell bodies in 5 dpf control dat:eGFP and dat:eGFP; elavl3:Gal4; UAS:fynY531F larvae (n=4). (B) Left: live confocal imaging of eGFP and mCherry in vDC neurons in 3 dpf control dat:mitoRFP; dat:eGFP; elavl3:Gal4 and dat:mitoRFP; dat:eGFP; elavl3:Gal4; UAS:fynY531F larval brain. Right: quantification of overlap of eGFP and mCherry signal in vDC neuron cell bodies in 3 dpf control dat:mitoRFP; dat:eGFP; elavl3:Gal4 and dat:mitoRFP; dat:eGFP; elavl3:Gal4; UAS:fynY531F larvae (n=6). (C) Left: live confocal imaging of eGFP and mCherry in vDC neurons in 5 dpf control dat:mitoRFP; dat:eGFP; elavl3:Gal4 and dat:mitoRFP; dat:eGFP; elavl3:Gal4; UAS:fynY531F larval brain. Right: quantification of overlap of eGFP and mCherry signal in vDC neuron cell bodies in 5 dpf control dat:mitoRFP; dat:eGFP; elavl3:Gal4 and dat:mitoRFP; dat:eGFP; elavl3:Gal4; UAS:fynY531F larvae (n=6). Statistical analysis was performed with two-tailed unpaired Student’s t-test. Bars represent mean±s.e.m. *P<0.05; **P<0.01; ***P<0.001. Scale bars: 50 µm (white); 100 µm (black).
Zebrafish neural FynY531F overexpression drives microglia activation and cytokine induction. (A) 4C4 immunolabeling of microglia in wild-type +/+ and elavl3:Gal4; UAS:fynY531F forebrain and midbrain (MB)/hindbrain (HB). (B) Quantification of 4C4-labeled microglia in 5 dpf +/+ and elavl3:Gal4; UAS:fynY531F larval brain (n=12). (C) Higher-magnification images of 4C4-labeled microglia in +/+ and elavl3:Gal4; UAS:fynY531F larvae. Yellow circles outline microglia with ramified morphology; yellow ovals outline microglia with intermediate or amoeboid morphology. (D) Quantification of microglia with ramified, intermediate and amoeboid morphologies in 5 dpf +/+ and elavl3:Gal4; UAS:fynY531F larval brain (n=4). (E) Reverse transcription quantitative PCR (RT-qPCR) of il1b, il12a, tnfa and irg1 in RNA extracts from control elavl3:Gal4 and elavl3:Gal4; UAS:fynY531F 5 dpf larvae (n=3 biological replicates for each genotype). Statistical analysis was performed with two-tailed unpaired Student’s t-test. Bars represent mean±s.e.m. ns, not significant; *P<0.05; **P<0.01. Scale bars: 50 µm (A); 20 µm (C).
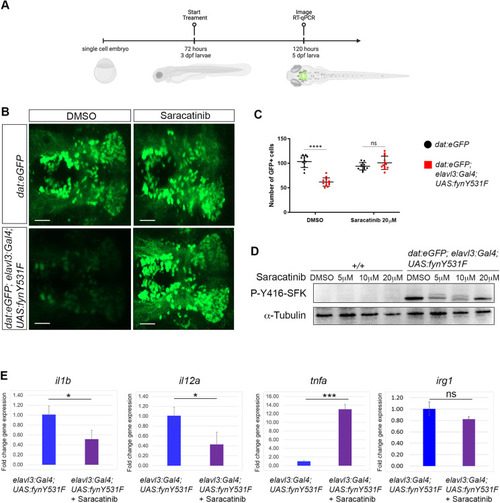
Src family kinase inhibitor Saracatinib suppresses FynY531F-driven dopaminergic neuron loss, Fyn activation, and il1b and il12a cytokine induction. (A) Time course of Saracatinib treatment beginning at 72 h post fertilization. (B) Live confocal imaging of vDC cluster eGFP dopaminergic neurons in 5 dpf control dat:eGFP and elavl3:Gal4; UAS:fynY531F larvae mock treated with DMSO or treated with 20 mM Saracatinib. (C) Quantification of vDC eGFP-positive neuronal cell bodies in 5 dpf control dat:eGFP and dat:eGFP; elavl3:Gal4; UAS:fynY531F larvae mock treated with DMSO or treated with 20 mM Saracatinib (n=12). Analysis was performed using two-way ANOVA with Tukey's multiple comparison. (D) Western blot of extracts from 5 dpf wild-type +/+ and dat:eGFP; elavl3:Gal4; UAS:fynY531F larvae treated with DMSO and increasing amounts of Saracatinib, and probed with anti-Src family kinase P-Y416-SFK. Anti-acetylated tubulin and anti-alpha-tubulin were used as loading controls. (E) RT-qPCR of il1b, il12a, tnfa and irg1 in RNA extracts from untreated and 20 µM Saracatinib-treated 5 dpf elavl3:Gal4; UAS:fynY531F larvae (n=3 biological replicates for all genotypes and conditions). This experiment was performed alongside the CAPE and Ac-YVAD-cmk experiments in Fig. 7C,D, using shared untreated controls. Control data in this panel are also shown in Fig. 7C,D. Statistical analysis was performed with two-tailed unpaired Student's t-test. Bars represent mean±s.e.m. ns, not significant; *P<0.05; ***P<0.001; ****P<0.0001. Scale bars: 50 µm.
Stat3 inhibition suppresses FynY531F-driven dopaminergic neuron degeneration and induction of il1b, il12a, tnfa and irg1 expression. (A) Western blot of 3 dpf and 5 dpf +/+, control elavl3:Gal4 and elavl3:Gal4; UAS:fynY531F larval extracts probed with anti-Stat3-Y705-PO antibody shows increased Stat3-Y705 phosphorylation in elavl3:Gal4; UAS:fynY531F larvae. elavl3:Gal4; UAS:fynY531F larvae treated from 3 dpf to 5 dpf with 10 µM Saracatinib (Src family inhibitor) show reduced Stat3-Y705 phosphorylation. Blot was probed with anti-Gapdh and anti-β-actin as protein-loading controls. (B) Quantification of band intensities on Stat3-Y750-PO western blot. (C) Top: live confocal imaging of vDC eGFP dopaminergic neurons in 5 dpf control dat:eGFP and dat:eGFP;elav:Gal4; UAS:fynY531F larvae show rescue of dopaminergic neuron loss after treatment with 10 µM S3I-201 (Stat3 inhibitor). Bottom: quantification of vDC eGFP dopaminergic neuron number in 5 dpf control dat:eGFP and dat:eGFP;elav:Gal4; UAS:fynY531F larvae after treatment with 10 µM S3I-201 (n=12). Statistical analysis was performed using two-way ANOVA with Tukey's multiple comparison. (D) Top: confocal imaging of fixed, whole-mount anti-4C4 immunolabeling in brain of 5 dpf control dat:eGFP and dat:eGFP;elav:Gal4; UAS:fynY531F larvae at low magnification (top row) and high magnification (bottom row) after treatment with vehicle (DMSO) and Stat3 inhibitor (S3I-201). Bottom: quantification of 4C4-positive microglia with ramified, intermediate or amoeboid morphology number in 5 dpf control dat:eGFP and dat:eGFP;elav:Gal4; UAS:fynY531F larvae and after treatment with 10 mM Stat3 inhibitor S3I-201 (n=12). Analysis was performed using two-way ANOVA with Tukey's multiple comparison. (E) RT-qPCR of il1b, il12a, tnfa, and irg1 in RNA extracts from untreated and 10 µM S3I-201-treated 5 dpf elavl3:Gal4; UAS:fynY531F larvae (n=3 biological replicates for each genotype). Statistical analysis was performed with two-tailed unpaired Student's t-test. Bars represent mean±s.e.m. ns, not significant; *P<0.05; **P<0.01; ***P<0.001; ****P<0.0001. Scale bars: 100 µm (C); 20 µm (D).
NF-κB and Caspase-1 inhibition suppresses FynY531F-driven dopaminergic neuron loss and induction of il1b, il12a and irg1 expression. (A) Live confocal imaging of vDC eGFP-positive dopaminergic neurons in 5 dpf control dat:eGFP and dat:eGFP;elav:Gal4; UAS:fynY531F larvae show rescue of dopaminergic neuron loss after treatment with 0.5 µM caffeic acid phenethyl ester (CAPE; NF-κB inhibitor) and 20 µM Ac-YVAD-cmk (Caspase-1 inhibitor). (B) Quantification of vDC eGFP-positive cells (n=12). Analysis was performed using two-way ANOVA with Tukey's multiple comparison. (C,D) RT-qPCR revealed significantly reduced levels of il1b, il12a and irg1 after treatment of dat:eGFP;elav:Gal4; UAS:fynY531F larvae with 0.5 µM CAPE (C) and 20 µM Ac-YVAD-cmk (D). tnfa was increased after treatment with 0.5 µM CAPE and 20 µM Ac-YVAD-cmk (n=3 biological replicates for each genotype and condition). These experiments were performed together with the Saracatinib experiment in Fig. 4E, using shared untreated controls. Control data in these panels are also shown in Fig. 4E. Statistical analysis was performed with two-tailed unpaired Student's t-test. Bars represent mean±s.e.m. ns, not significant; *P<0.05; **P<0.01; ****P<0.0001. Scale bars: 50 µm.
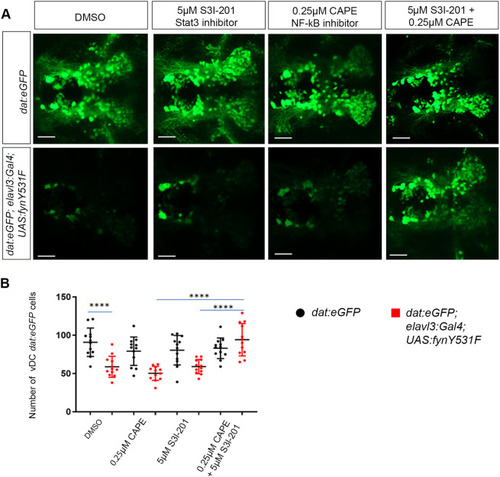
Dual inhibition of NF-κB and Stat3 acts synergistically to suppress FynY531F-driven dopaminergic neuron degeneration. (A) Live confocal imaging of vDC eGFP dopaminergic neurons in 5 dpf control dat:eGFP and dat:eGFP;elav:Gal4; UAS:fynY531F larvae after treatment with mock DMSO, 5 µM S3I-201, 0.52 µM CAPE, and 5 µM S3I-201 plus 0.25 µM CAPE. (B) Quantification of vDC eGFP dopaminergic neuron number in 5 dpf control dat:eGFP and dat:eGFP;elav:Gal4; UAS:fynY531F larvae after treatment with mock DMSO, 5 µM S3I-201, 0.25 µM CAPE, and 5 µM S3I-201 plus 0.25 µM CAPE (n=12). Analysis was performed using two-way ANOVA with Tukey's multiple comparison. Bars represent mean±s.e.m. ****P<0.0001. Scale bars: 50 µm.
Acknowledgments
This image is the copyrighted work of the attributed author or publisher, and
ZFIN has permission only to display this image to its users.
Additional permissions should be obtained from the applicable author or publisher of the image.
Full text @ Dis. Model. Mech.
Your Input Welcome
Thank you for submitting comments. Your input has been emailed to ZFIN curators who may contact you if
additional information is required.
Oops. Something went wrong. Please try again later.