Forced swimming at 5dpf reduces a larva's cortisol response to a subsequent exposure to the same type of stress. (A,B) Comparison steps and time points for measuring baseline whole-body cortisol levels (A) and whole-body cortisol trajectory post-vortex (B) in 6 dpf larvae with or without ELC exposure. (C,D) Baseline whole-body cortisol levels (C) and whole-body cortisol trajectory post-vortex (D) in control (black) and ELC (orange) larvae. (C) P=0.90 by Mann–Whitney test; N=6 per group. Box and whiskers (min. to max.), all data points shown. (D) 10′ and 20′: ****P<0.0001, 30′: **P=0.003, 40′: P=0.125, 60′: P=0.99 by Bonferroni's test after a two-way ANOVA on square root-transformed cortisol levels; N=6 per group. Mean±s.e.m. The red line represents the average baseline whole-body cortisol levels from C.
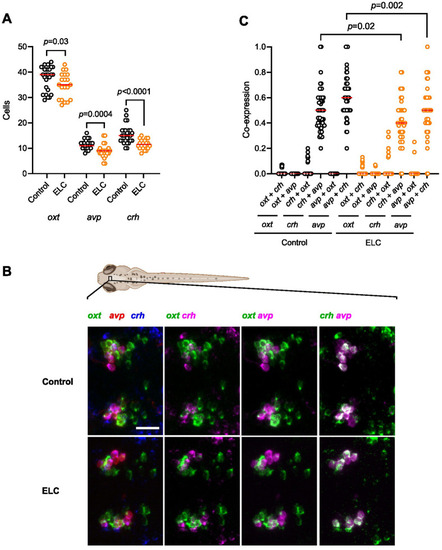
Peptidergic NPO cell numbers in wild-type larvae with or without ELC exposure. (A) Comparison of cell numbers in the NPO with or without ELC exposure. (B) Maximum intensity projections of confocal stacks show NPO cells expressing oxt (green), avp (red), or crh (blue) in control (above) or ELC (below) larvae. Double-color comparisons of each pairwise combination are also shown. Scale bar: 25 μm. (C) Comparison of coexpression levels in the NPO with or without ELC exposure. (A,C) Orange: ELC larvae, N=20; black: control larvae, N=27; all data points shown; P-values by Mann–Whitney tests. (See also Results.)
Transcript abundance of genes involved in cortisol metabolism, steroidogenesis, and stress modulation in control and ELC larvae. (A-L) Fold change in expression of selected genes relative to control reference samples, measured under baseline (basal) conditions and at 30, 60, or 120 min after high-strength vortex exposure in control (black) and ELC (orange) larvae; N=5 per group. P-values for group and time factors from two-way ANOVAs are shown in the top-left corner of each panel. Asterisks indicate Bonferroni's test results following the ANOVAs (*P<0.05, **P<0.01, ***P<0.001). (M) Density grid summarizing fold change comparisons in expression levels of the 12 target genes. Asterisks on the right denote results for the group and time factors from two-way ANOVAs. Asterisks within ELC panels indicate Bonferroni's test results following the ANOVAs. (See Results for details.)
ELC alters GCR to a second vortex during the refractory period. (A) Sampling scheme for measuring GCR to homotypic stress in 6 dpf larvae with or without ELC. (B) Whole-body cortisol following two 3-min vortices applied within a 30-min refractory period in control (black) and ELC (orange) larvae. Control larvae did not show cortisol levels above baseline in response to a second 3-min vortex, while ELC larvae did. N=6 per group. ****P<0.0001 by unpaired two-tailed t-test. (C) Baseline whole-body cortisol levels in ELC larvae relative to controls (data from Fig. 1C), depicted for the sake of interpreting panels D and E. P=0.40 by one-sample t-test against fold change of ‘1′. (D) GCR to 1st and 2nd vortices relative to baseline in control and ELC larvae. Data from Fig. 1C,D (10 min post-vortex), and B. N=6 per group. P-values indicate Bonferroni's test results following a two-way ANOVA. (E) GCR to the 2nd vortex relative to GCR to the 1st vortex in control (black) and ELC (orange) larvae (data from D). P<0.0001 by unpaired two-tailed t-test. (B-E) Box and whiskers (min. to max.), (C-E) all data points shown.
Proposed model illustrating the initial adaptation of the HPI axis following ELC. Prolonged early-life activation of the HPI axis, induced by increased environmental challenge, diminishes the NPO's capacity to influence downstream HPI axis activity. Baseline conditions show enhanced cortisol inactivation, which can persist upon stress onset. There is an increase in cortisol synthesis capacity and elevated levels of stress modulators. These adaptations enhance the larva's capability to regulate GC levels, preventing excess cortisol while facilitating its production in response to familiar stress.
Acknowledgments
This image is the copyrighted work of the attributed author or publisher, and
ZFIN has permission only to display this image to its users.
Additional permissions should be obtained from the applicable author or publisher of the image.
Full text @ Biol. Open
Your Input Welcome
Thank you for submitting comments. Your input has been emailed to ZFIN curators who may contact you if
additional information is required.
Oops. Something went wrong. Please try again later.