
- Title
-
Blind But Alive - Congenital Loss of atoh7 Disrupts the Visual System of Adult Zebrafish
- Authors
- Hammer, J., Röppenack, P., Yousuf, S., Machate, A., Fischer, M., Hans, S., Brand, M.
- Source
- Full text @ Invest. Ophthalmol. Vis. Sci.
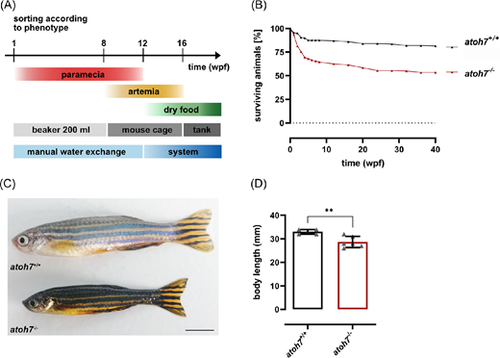
Adult atoh7 mutants display a dark body pigmentation and growth retardation. (A) Scheme of the modified raising strategy to obtain adult mutant animals. Mutants and wildtype/heterozygous siblings are separated according to their phenotype at 1 wpf (see Supplementary Fig. S1) and raised under the same conditions. Until 8 wpf, animals are kept in 200 mL beakers with manual water exchange every other day and exclusively fed with paramecia. At 8 wpf, animals are transferred into mouse cages and additionally fed with artemia. At 12 wpf, mouse cages are connected to the system. Feeding of paramecia is terminated and more and more complemented with dry food, in addition to paramecia. By 16 wpf, the animals are exclusively fed with dry food and moved to tanks. (B) Quantification of the survival of wildtype/heterozygous versus mutant fish revealed a lower survival rate of mutant animals. (C) Adult mutants (6 months post fertilization) are characterized by a darker pigmentation as well as a reduced body length. (D) Quantification of the body size revealed a significantly reduced length of mutants compared to wildtype and heterozygous siblings. Scale bars represent 5 mm. Statistics: all data are represented as mean ± SD, 1-way ANOVA with Tukey's multiple comparison test, *P < 0.05; **P < 0.01; ***P < 0.001, or ****P < 0.0001. wpf, weeks post fertilization. |

atoh7 Mutant retinae show reduced thickness and structural defects. (A) Hematoxylin and eosin (H&E) stainings of wildtype and mutant animals. Overall, retinal morphology is similar in wildtype as well as mutants and individual nuclear and plexiform layers can be distinguished (left panel). However, detailed analysis (middle panel) revealed that mutant retinae miss the retinal nerve fiber layer (RNFL). Additionally, the cone outer segments (COS) appear to be less organized and the rod outer segments (ROS) are shorter in mutant specimens. Optical coherence tomography (OCT) cross sections in live animals confirmed these observations (right panel). (B) Quantification showed that the relative retinal thickness of mutant fish (compared to body size) is significantly reduced. (C) Quantifications of the relative thicknesses of individual layers (as percentage of whole retinal thickness, measured layers depicted in yellow in A) showed no significant differences except for the RNFL. (D) Gnat2 staining of cone outer segments in retinal flat mounts reveals defects in the regular cone mosaic (colored scheme on the upper left) in mutant retina. (E) Cone photoreceptor mosaic in wildtype and mutant retinae in en face projections calculated from OCT cross sectional scans. (F) Quantification of the number of cones in the OCT en face projections revealed a significant reduction in mutant retinae. Scale bars represent 250 µm in overviews, 25 µm in magnifications (A) and 50 µm in flat mounts (D, E). Statistics: All data are represented as mean ± SD, unpaired t-test (B, F), t-test with multiple comparisons (C), *P < 0.05; **P < 0.01; ***P < 0.001, or ****P < 0.0001. COS, cone outer segments; GCL, ganglion cell layer; INL, inner nuclear layer; IPL, inner plexiform layer; ONL, outer nuclear layer; OPL, outer plexiform layer; RNFL, retinal nerve fiber layer; ROS, rod outer segments; RPE, retinal pigment epithelium. |

atoh7 mutants lack retinal ganglion cells and are blind. (A) Quantification of the number of nuclei in the GCL revealed a significant reduction in mutant fish. (B) The qPCR analysis showed a highly significant reduction of the ganglion cell specific marker islet2b mRNA in mutant retinae. (C) Expression analysis of islet2b using in situ hybridization shows specific expression (yellow dots) in the GCL of wildtype but not in mutant retinae. Nuclei were stained with DAPI (white). (D) Representative cross sections of wildtype and mutant retinae stained with H&E at the level of the optic nerve. In contrast to wildtype fish that form a regular optic nerve (upper panel), the optic nerve is absent in mutant retinae which rather contain an ectopic blood vessel connecting the subretinal space with the vitreous body (lower panel). (E) Calretinin (yellow), a marker for nerve fibers, is only detected in wildtype but not in mutant retinae. Nuclei were stained with DAPI (white). (F) Graphic representation of the velocity in anti-clockwise (+) and clockwise (–) direction of the eye movements of a representative wildtype (black line) and mutant (red line) fish depending on the stimulus (grey line). Wildtype fish track the stimulus reliably at low spatial frequencies in both directions but movements become more random at high spatial frequencies. Only random eye movements could be observed in mutant fish. (G) The optokinetic response (OKR) was measured with varying spatial frequencies (black-white, 30% contrast, 0.2/0.3/0.4 cycles per degree [cpd]). Whereas atoh7+/+ and atoh7± achieved comparable gains dependent on the spatial frequency (values), no OKR could be observed in mutants. Scale bars represent 250 µm in overviews and 25 µm in close-ups. Statistics: all data are represented as mean ± SD, t-test with multiple comparisons, *P < 0.05; **P < 0.01; ***P < 0.001, or ****P < 0.0001. cpd, cycles per degree; GCL, ganglion cell layer; INL, inner nuclear layer; IPL, inner plexiform layer; ONL, outer nuclear layer; OPL, outer plexiform layer; RNFL, retinal nerve fiber layer; RPE, retinal pigment epithelium. |

Mutant retinae contain excess numbers of amacrine and bipolar cells as well as Müller glia. (A) Representative images of antibody stainings against HuC/D (yellow), a marker for amacrine and ganglion cells, show HuC/D expression in the INL and GCL of both mutant and wildtype retinae. Nuclei are stained with DAPI (white). (B) Quantification of the overall number of HuC/D positive cells in both INL and GCL revealed no statistical difference. (C, D) Quantifications of HuC/D positive cells in individual layers indicated a significant reduction in the GCL (C) and a significant increase in the INL of mutant retinae (D). (E) Representative images of bipolar cells labeled with PKCα (yellow) showed that cell bodies are located in the INL and GCL of both mutant and wildtype retinae. Nuclei were stained with DAPI (white). (G) Quantification of PKCα positive cells showed a significant increase in mutant retinae. (F) Representative images of an antibody staining against the Müller glia cell specific marker GFAP (yellow) shows cell bodies of Müller glia cells that were located in the inner nuclear layer (INL) of wildtype and mutants’ retinae as well as their processes that span the entire retina. Nuclei were stained with DAPI (white). (H) Quantification of zrf1-positive cells revealed a significant increase in mutant retinae. Scale bars represent 25 µm. Statistics: all data are represented as mean ± SD, unpaired t-test, *P < 0.05; **P < 0.01; ***P < 0.001, or ****P < 0.0001. GCL, ganglion cell layer; INL, inner nuclear layer; ONL, outer nuclear layer. PHENOTYPE:
|

Midbrains of atoh7 mutants are characterized by structural changes in the area of the optic tectum. (A) Dorsal views of representative wildtype and mutant brains. (B) Comparison of the relative area of specific brain parts compared to the area of the whole brain reveals that mutants possess a significantly larger telencephalon (Tel) but a significantly smaller optic tectum (TeO). In contrast, the cerebellum (Cb) displays no difference. (C) Representative cross sections of the optic tectum of wildtype and mutant stained with H&E. The TeO appears reduced in size and the PGZ appears to be thicker. The tectal ventricle (TeV) was also smaller in the mutant brain. (D) Cross section of a zebrafish optic tectum with tectum opticum (TeO, purple), periventricular grey zone (PGZ, red), lateral division of valvula cerebelli (Val), torus longitudinalis (TL), and brain stem (yellow). The red arrow represents the brain stem diameter used as reference. (E) Quantifications confirmed that the area of the TeO (relative to the area of the brain stem was significantly reduced in mutants. (F) The relative area of the PGZ (normalized to brain stem area) was not altered in mutants compared to wildtypes. (G) Quantification of the relative area of the TeV (normalized to the brain stem area) indicated a very strong reduction in mutants. (H) Representative cross sections of the optic tectum stained with H&E. In wildtype, six layers can be distinguished: pia mater (PM), stratum fibrosum marginale (SFM), stratum opticum (SO), stratum fibrosum et griseum superficiale (SFGS), stratum album centrale (SAC), and stratum periventriculare (SPV). In the mutant, no stratum opticum (SO) could be detected and stratum fibrosum et griseum superficiale (SFGS) appeared to be thinner. (I) Quantification of the relative thickness of the SFGS (normalized to brain stem diameter) confirmed a significant reduction in mutants. Scale bars represent 250 µm in overviews and 25 µm in close-ups. Statistics: all data are represented as mean ± SD, unpaired t-test, *P < 0.05; **P < 0.01; ***P < 0.001, or ****P < 0.0001. PHENOTYPE:
|