
- Title
-
EZH2 specifically regulates ISL1 during embryonic urinary tract formation
- Authors
- Mingardo, E., Kalanithy, J.C., Dworschak, G., Ishorst, N., Yilmaz, Ö., Lindenberg, T., Hollstein, R., Felger, T., Angrand, P.O., Reutter, H., Odermatt, B.
- Source
- Full text @ Sci. Rep.

Luciferase sliding window approach identifies a promoter in the reverse strand of the rs2303751 harboring region. (A) Manhattan plot of the CBE GWAS. The dotted box shows the region harboring ISL15 and is zoomed into (B) Overview of the genomic region where the luciferase is performed referred to the ISL1 gene. In detail, Fragment 1, Fragment 2 and Fragment 3 coordinates are shown relatively to the distance from the ISL1 transcription starting site (TSS) (top) and also in chromosome 5 coordinates (hg38 /lower). Blue and red arrows indicate the orientation of the luciferase-tested fragments. (C) Luciferase assay of the forward (blue) and flipped (red) fragments relative to the empty control vector pGL3 (in gray); significance over control is observed only for the flipped Fragment 2. (D) Fragment 2 luciferase assay with the rs2303751 variant A > G in both forward and flipped orientations displays no significant difference between major (A) and minor (G) allele. |
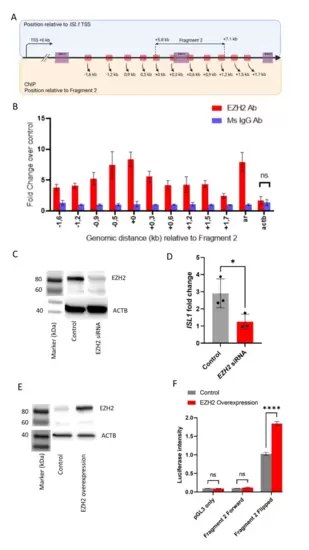
EZH2 enhance ISL1 expression through binding on Fragment 2. A) schematic reppresentation of the region tested for ChIP-qPCR in ISL1 (red segments) with distance relative to the 5’ of Fragment 2 in kb. B) ChIP-qPCR fold change representing EZH2 bound genomic DNA relative to mouse IgG bound DNA. Androgen receptor (ar) genomic DNA as positive control6 and actin b as negative control. All fold change except for actin b are significant over IgG control. C) Western blot against EZH2 shows a succefull siRNA knockdown of EZH2 compared to control. D) ISL1 qPCR with EZH2 siRNA dispalys a reduced ISL1 signal. E) Western blot on EZH2 with control vector and EZH2 overexpression plasmid confirms the efficency of the overexpression. F) Luciferase assay with EZH2 overexpression (red bars) and control (gray bars). As before, vector (pGL3) and Fragment 2 forward show only little expression in both cases while EZH2 overexpression enchances the reporter activitiy of the plasmid with flipped Fragment 2 significantly. |
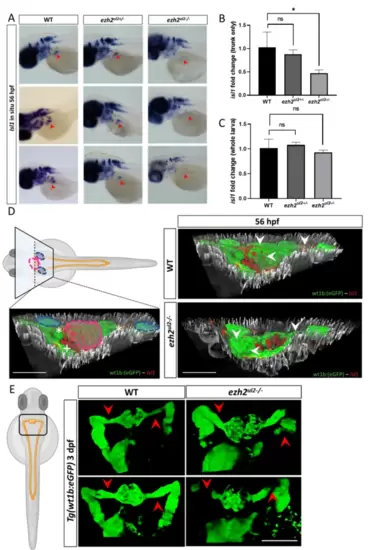
Ezh2 mediates isl1 regulation with tissue specificity on the nephric region and causes defective nephric duct development. (A) isl1 in situ hybridization in WT, ezh2 +/- and KO larvae at 56 hpf. Red arrows indiacate the expression of isl1 in the nephric region that shows clear staining in the WT and ezh2 +/- lines and a strong reduction in the ezh2 KO zfl. Isl1 expression results almost not alterated in the brain and spinal chord of all genotypes. (B) Normalized isl1 qPCR in head-chopped embryo at 56 hpf shows a significantly reduced signal in the ezh2 KO line. (C) Normalized isl1 qPCR of whole zfl at 56 hpf shows no significant reduction of isl1 expression. (D) Isl1 immuno histochemistry (red cells) in Tg(wt1b: eGFP) line (in green) and double transgenic Tg(wt1b: eGFP) – ezh2 KO line. Left pannel indicates the location of the transversal paraffin section in reference of the whole zfl and nephric region. Blue circles indicate the sagittal nephric ducts; purple circle indicates the glomeruli region, white asterics the sagittal nephric ducts and the white plus the pancreas. Right pannels show the 3D co-localization of Isl1 protein (red) on the glomeruli and nephric ducts (green) in the WT (top) and ezh2 KO (lower) 56 hpf zfl. A clear absence of Isl1 signal locates to the glomeruli and nephric ducts of the ezh2 KO line compared to WT. (E) Nephric ducts of the ezh2 KO larvae display developmental defects and malformation at 3 dpf. Red arrows indicate the correct protrusion of the nephric duct in the WT and absence of GFP signal, togeather with dilated nephric ducts in the ezh2 KO. EXPRESSION / LABELING:
PHENOTYPE:
|
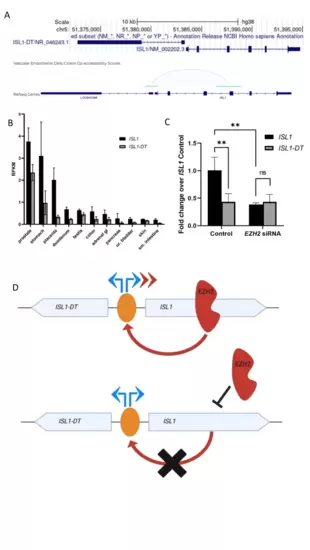
Fragment 2 promoter regulates specifically ISL1 expression through EZH2 and disturbs the normal basal expression of ISL1-DT/ISL1 cluster. (A) Upper panel shows the genomic overview of ISL1 location with 115 bp upstream the reverse orientated ISL1-DT. Black stripe indicates the position of Fragment 2 and the arrow its active orientation. Lower panel displays chromatin interaction from sci-ATAC-seq3 for ISL1 in the fetal ureteric bud cells11. Light blue bridge indicates the interaction of the genomic locus where Fragment 2 resides with the shared promoter region of ISL1 and ISL1-DT (light blue bridge). (B) Human adult RNA-seq shows the expression pattern of ISL1 and ISL1-DT in different tissues. These genes are generally expressed with higher counts for ISL1 and lower for ISL1-DT. (C) qPCR of ISL1 and ISL1-DT with control and EZH2 siRNA shows a reduced signal of ISL1 but unchanged ISL1-DT expression in HEK 293 cells. (D) Proposed molecular mechanism for the expression pattern of ISL1 and ISL1-DT mediated by EZH2. Top panel shows physiological condition, EZH2 binds to the Fragment 2 promoter and specifically enhances ISL1 expression (red arrows). In pathological condition, EZH2 does not bind to the Fragment 2 and the expression of ISL1 is reduced, but not the expression of ISL1-DT. |