
- Title
-
VPS13B is localized at the interface between Golgi cisternae and is a functional partner of FAM177A1
- Authors
- Ugur, B., Schueder, F., Shin, J., Hanna, M.G., Wu, Y., Leonzino, M., Su, M., McAdow, A.R., Wilson, C., Postlethwait, J., Solnica-Krezel, L., Bewersdorf, J., De Camilli, P.
- Source
- Full text @ J. Cell Biol.
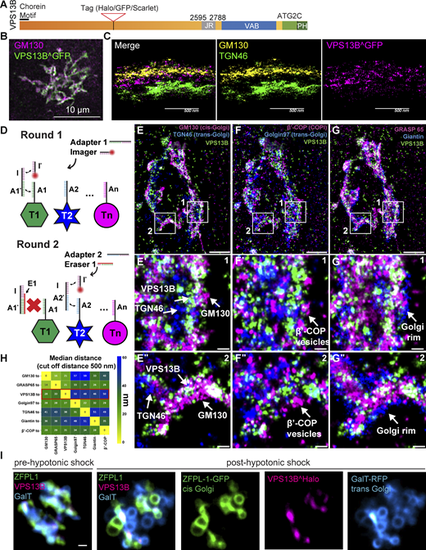
VPS13B is localized at the interface between cis-Golgi and trans-Golgi membranes. (A) Domain cartoon of human VPS13B. (B) COS7 cells expressing codon-optimized human VPS13B^GFP immunolabeled for GFP and GM130. Scale bar = 10 µm. (C) Cross-section (side view) of HeLa cells expressing codon-optimized human VPS13B^GFP immunolabeled for GFP, GM130, and TGN46 imaged using 4Pi SMS microscopy. Scale bar = 500 nm. (D) Schematic representation of labeling steps used for FLASH-PAINT. FLASH-PAINT performed in HeLa cells expressing VPS13B^GFP and immunolabeled with anti-GFP. (E–G) FLASH-PAINT signals of a Golgi complex immunolabeled for the indicated Golgi complex targets. Scale bar = 2 µm. High magnification fields of the boxed areas in fields E–G are shown below in fields E′–G′ and E″–G″. Scale bar = 250 nm. (H) Median distances between super-resolved signals of different targets. Only signals closer than 500 nm to each other were considered. (I) Snapshots of COS7 cell expressing VPS13B^halo, ZFPL1-GFP (a cis-Golgi marker), and GalT-RFP (a trans-Golgi marker) before and after (8 min) hypotonic shock. Scale bar = 1 µm. |
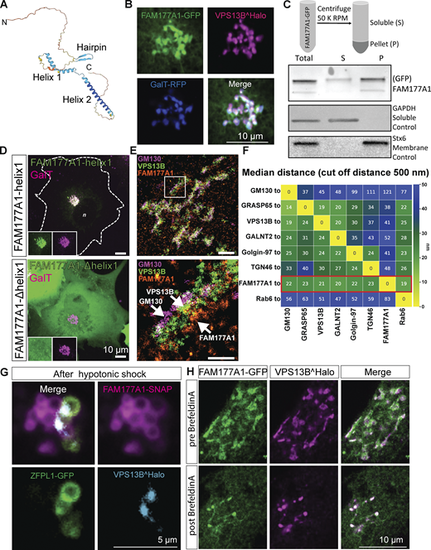
FAM177A1 is a protein neighbor of VPS13B in the Golgi complex. (A) Alphafold2 prediction of human FAM177A1 structure. (B) COS7 cells expressing VPS13B^Halo, FAM177A1-GFP, and GalT-RFP showing that FAM177A1 is localized at the Golgi complex. (C) Western blot analysis of soluble cytosolic fraction and total membrane faction of HeLa cells expressing FAM177A1-GFP. GAPDH was used as a soluble control, Stx6 as a membrane control protein. (D) Top panel: Co-expression of FAM177A1-helix1-GFP and GalT-RFP in COS7 cells. Bottom panel: Co-expression of FAM177A1-Δhelix 1-GFP and GalT-RFP in COS7 cells. Scale bar = 10 µm. (E) FLASH-PAINT performed in HeLa cells expressing VPS13B^GFP and FAM177A1-Halo and immunolabeled with anti-GFP, anti-halo, and anti-GM130 antibodies. (F) Median distances between super-resolved signals of different Golgi complex targets. Only signals closer than 500 nm to each other were considered. (G) Snapshots of COS7 cells expressing FAM177A1-SNAP, ZFPL1-GFP, and GalT-RFP treated with water for 10 min. Scale bar = 5 µm. (H) Snapshots of HeLa cells expressing FAM177A1 GFP and VPS13B^Halo before and after BFA (5 µg/ml for 50 min) treatment. Scale bar = 10 µm. Source data are available for this figure: SourceData F2. |
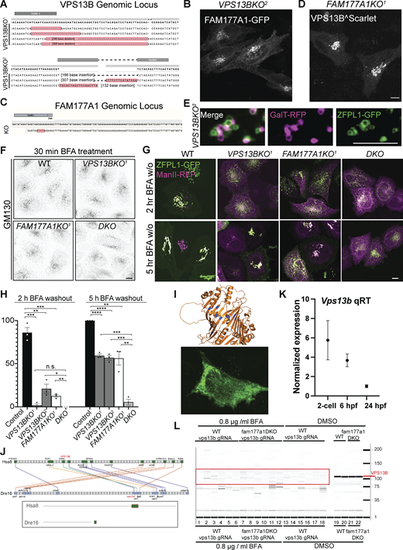
Generation of VPS13B and FAM177A1 KO HeLa cells and evidence that the zebrafish genome encodes and expresses a VPS13B homolog. (A) Sanger sequencing of VPS13BKO1 and VPS13BKO2 HeLa cells; superscripts indicate different clones. (B)VPS13BKO2 HeLa cells expressing FAM177A1-GFP. (C) Sanger sequencing of FAM177A1KO homozygous HeLa cells. (D)FAM177A1KO cells expressing VPS13B^Scarlet. Scale bar = 10 µm. (E) Snapshots of Golgi fragments of a VPS13BKO2 HeLa cell expressing ZFPL1-GFP, and GalT-RFP after a 10-min hypotonic shock. Scale bar = 5 µm. (F) Anti-GM130 immunofluorescence of WT, VPS13BKO1, FAM177A1KO, and VPS13B;FAM177A1 DKO cells after 30 min in BFA (5 µg/ml). (G) WT, VPS13BKO1, FAM177A1KO, and FAM177A1;VPS13B DKO HeLa cells transfected with ZFPL1-GFP and ManII-RFP after 1 h in BFA (5 µg/ml) followed by subsequent washings as indicated. (H) Quantification of Golgi complex reformation in cells of the indicated genotypes after BFA washout for 2 or 5 h. Data are mean ± SEM n = 3 per condition; in each condition, 20–50 cells were quantified. Unpaired, two-tailed t tests. n.s., not significant. ***P < 0.001; **P < 0.01; *P < 0.05. (I) Top: Sites (blue) within the RBG structure of VPS13B where hydrophobic amino acids facing the floor of the hydrophobic grove were replaced by charge amino acids (L65K, I81E, L90E, I155R, L169E, A176E, I203R, L238D, I355K, L264R) to generate the Lipid Transport Dead (LTD) Mut1. Bottom: HeLa cell expressing VPS13LTDmut1 showing small clusters of the protein sparse throughout the cytoplasm rather than a Golgi localization. (J) Conserved syntenies of VPS13B in human and zebrafish validate orthology implied by sequence comparisons. A small part of human (Homo sapiens) chromosome 8 (Hsa8, green part in insert) has conserved synteny with a short portion of zebrafish (Danio rerio) chromosome16 near its right tip (Dre16, green portion in insert). (K) qRT-PCR analysis of WT vps13b in early zebrafish embryos at two-cell stage, 6 hpf, 24 hpf. (L) Genotyping of vps13b CRISPR target locus in WT zebrafish embryos injected with vps13b gRNAs/Cas9 and treated with 0.8 µg/ml BFA (samples 1–6), fam177a1a;fam177a1b DKO embryos injected with vps13b gRNAs/Cas9 and treated with 0.8 µg/ml BFA (samples 7–12), WT zebrafish embryos injected with vps13b gRNAs/Cas9 and treated with DMSO (samples 13–18), WT zebrafish embryos treated with DMSO (samples 19, 20), and fam177a1a;fam177a1b DKO embryos injected with vps13b gRNAs/Cas9 and treated with DMSO (samples 21, 22). |

A partnership of fam177a1 and vps13b in zebrafish. (A) Alphafold2 prediction of human VPS13B and zebrafish Vps13b. (B) Representative images of WT and fam177a1a;fam177a1b DKO (fam177a1DKO) zebrafish embryos that are either uninjected or injected with vps13b gRNAs/Cas9. The left panel shows embryos treated with DMSO at 6 hpf until 25 hpf whereas right panel shows embryos treated with 0.8 µg/ml BFA at 6 hpf until 25 hpf. (C) Quantifications of tail length results shown in B. Data are shown as means ± SEM, Unpaired, two-tailed t tests. n.s., not significant. ****P < 0.0001; ***P < 0.001; **P < 0.01. PHENOTYPE:
|
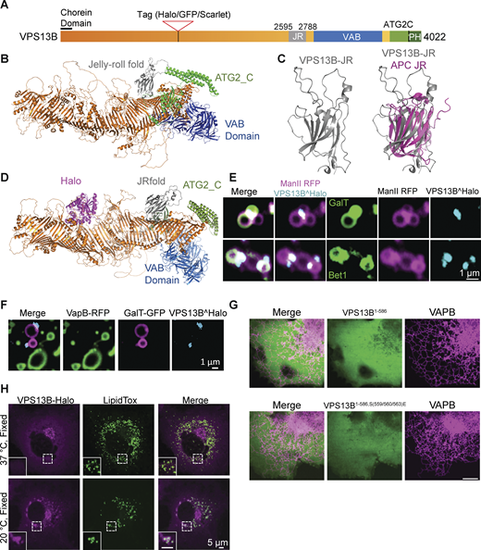
Structure and localization of VPS13B. (A) Domain structure of human VPS13B. (B) Alphafold2 predicted structure of full-length human VPS13B; orange indicates the rod consisting of 13 RBG domains. (C) Alphafold2 prediction of the Jelly Roll (JR) domain of VPS13B alone on the left and overlayed with the jelly-roll fold of anaphase-promoting complex subunit Doc1p/Apc10 on the right. (D) Alphafold2 prediction of VPS13B internally tagged with Halo tag (magenta). (E) Snapshots of Golgi complex fragments of HeLa cells expressing VPS13B^Halo, ManII-RFP (a medial-Golgi marker), and either GalT-GFP (top panel) or Bet1-GFP (bottom panel) after a 10-min hypotonic shock. Scale bar = 1 µm. (F) Snapshots of Golgi complex and ER fragments of HeLa cells expressing VPS13B^Halo, VapB-RFP, and GalT-GFP after a 10-min hypotonic shock. Scale bar = 1 µm. (G) Top panel: HeLa cells co-expressing VapB-RFP and the N-terminal fragment of VPS13B (a.a. 1–586). Bottom panel: HeLa cells co-expressing VapB-RFP and the mutant N-terminal fragment (a.a. 1–586): VPS13BS559E, S560E, S563E. Scale bar = 10 µm. (H) COS7 cells expressing VPS13B^Halo and kept at 37°C (top panel) or shifted to 20°C for 30 min before fixation (bottom panel) and then stained with Lipid Tox. Scale bar = 5 µm. |
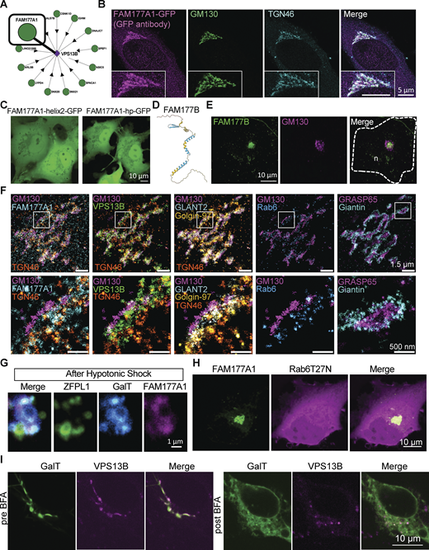
Human FAM177A1 and FAM177B localize at the Golgi complex. (A) Bioplex data showing predicted partners of VPS13B (https://bioplex.hms.harvard.edu/explorer/network.php). (B) HeLa cells expressing FAM177A1-GFP immunolabeled with anti-GFP, anti-GM130, and anti-TGN46 antibodies. (C) COS7 cells expressing FAM177A1-helix2-GFP (left) or FAM177A1-Hairpin-GFP (right). (D) Alphafold2 predicted structure of FAM177B. (E) HeLa cells expressing FAM177B-flag fixed and immunolabeled with anti-flag and anti-GM130 antibodies. n: nucleus, scale bar = 10 µm. (F) FLASH-PAINT performed in HeLa cells expressing VPS13B^GFP and FAM177A1-Halo and immunolabeled with antibodies directed against GFP, halo, GM130, GLANT2, Golgin-97, Rab6, TGN46, GRASP65, and Giantin. (G) Snapshots of the Golgi complex of a HeLa cells expressing ZFPL1-GFP, GalT-RFP, and FAM177A1^Halo after a 10-min hypotonic shock. Scale bar = 1 µm. (H) HeLa cells expressing FAM177A1-GFP and Rab6T27N-RFP. Scale bar = 10 µm. (I) HeLa cells expressing GalT-RFP and VPS13B^Halo before (left panel) and after BFA treatment (5 µg/ml for 40 min, right panel). Scale bar = 10 µm. |