
- Title
-
Transcripts of repetitive DNA elements signal to block phagocytosis of hematopoietic stem cells
- Authors
- Pessoa Rodrigues, C., Collins, J.M., Yang, S., Martinez, C., Kim, J.W., Lama, C., Nam, A.S., Alt, C., Lin, C., Zon, L.I.
- Source
- Full text @ Science
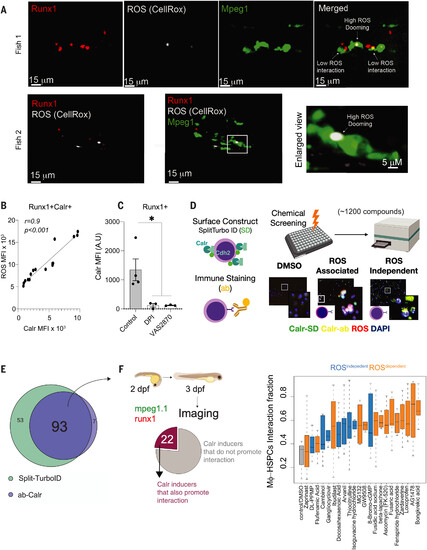
Chemical screen identifies ROS-dependent and ROS-independent surface Calr inducers. (A) Representative imaging from three independent experiments showing that ROS+Runx1+ cells are preferentially doomed by the macrophages. Green indicates Mpeg; red, Runx1; and white, the CellRox probe. (B) ROS levels in embryonic HSPCs marked by surface Calr. Data were analyzed by Pearson correlation. MFI, median fluorescence intensity; AU, arbitrary unit. Data points represent a pool of 100 to 300 3-dpf embryos (C) Surface Calr levels on HSPCs after ROS inhibition with DPI or VAS2870 (a Nox inhibitor). Data were analyzed by Kruskall-Wallis test followed by Dunn’s test; *P < 0.05. Data points represent a pool of 100 to 300 3-dpf embryos. Data in (A) to (C) are shown as means ± SEM. Experiments were performed in a pool of 100 to 300 zebrafish embryos in two independent experiments. (D) Schematic overview of the chemical screen. Two approaches were used to ensure that our system specifically recorded the surface Calr values: (i) HEK293 cells were transfected with the SPLIT-TURBO ID where the C terminus was designed to carry Cdh2, a membrane protein, whereas the N terminus was carrying Calr; and (ii) anti-Calr was conjugated with a A647 using Zenon technology. Next, the cells were plated in 384-well plates and treated with a panel of 1200 bioactive small molecules in three different concentrations, 5, 2.5, and 0.625 μM. The cells were also labeled with a ubiquitous ROS probe (CellRox) and DAPI for nuclear staining. After 24 hours, the Zeiss Cell Discoverer 7 (CR7) microscope was used to read the plates. Data were analyzed using the CellProfiler and R-Sight HTS software. SD, Split-turbo ID; ab, Calr antibody. (E) Numbers and overlap in compounds that induced surface Calr in HEK293 for both systems. Each compound was tested in replicates, and two to four random fields of view were chosen for acquisition. The same well was used for SPLIT-Turbo, Ab-Calr, and CellROX acquisition. (F) Left: number of compounds that increased surface Calr in vitro and in vivo (zebrafish embryos). Right: live image microscopy was used to determine the interaction fraction between macrophage-HSPCs using mpeg-GFP;runx1-mCherry embryos that label macrophage and HSPCs, respectively. Highlighted in blue are the ROS-independent compounds, and black represents the ROS-dependent compounds. Data are shown are means ± SEM. The zebrafish live-imaging experiments performed to determine the macrophage-HSPC interaction were conducted as two independent experiments, and a minimum of five embryos were imaged. |
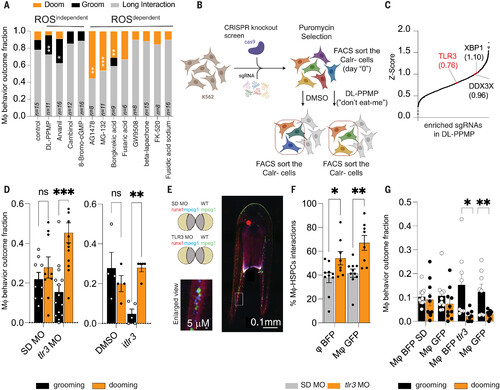
Tlr3 is required for HSPC grooming. (A) Stack Plot showing the macrophage interaction behavior in the presence of the Calr inducers. Grooming behavior is shown in the black bar, and dooming behavior as the orange bar. The imaging was conducted using 3-dpf zebrafish embryos. The exact sample size is indicated in the figure. n = 6 to 16 from two independent experiments. Data were analyzed by Wilcoxon matched-pairs signed rank test. *P = 0.0156, **P = 0.002, ***P = 0.001. (B) Schematic overview of the Gecko 2.0 CRISPR-Cas9 knockout screen. (C) sgRNAs significantly enriched (P < 0.05) were identified using MAGECK software and plotted as a cumulative stack on the basis of their Z score. The arrows indicate examples of significantly enriched sgRNAs, and their Z score is depicted inside the brackets. The screen was conducted using K562 cells. The screen was performed in three independent experiments. (D) Knock-down of Tlr3 (Tlr3 MO) or iTlr3 treatment reduces the fraction of HSPCs that are groomed but increases the fraction of HSPCs that are doomed in 3-dpf zebrafish embryos. The macrophage behavior outcome fraction was calculated by counting the total number of interacting macrophages and dividing by the total number of dooming or grooming events. Data points represent an image embryo: SD MO, n = 9; tlr3 MO, n = 11; DMSO, n = 4; and iTLR3, n = 5. Two independent experiments were performed. Two-way ANOVA followed by Sidak’s multiple comparisons test was used. **P = 0.0027; ***P = 0.00005. (E) Representative imaging showing the experimental design of the parabiosis experiment. (F) Both macrophages showed higher interaction rates with the HSPCs. *P = 0.04, **P = 0.0015. Data were analyzed using a two-way ANOVA test. The macrophage-HSPC interaction percentage was calculated by counting the total number of HSPCs (runx1+ cells) and dividing by the total number of HSPCs interacting with a macrophage. (G) Bar plot showing the macrophage behavior outcome fraction. The macrophage behavior percentage outcome was calculated by counting the total number of interacting macrophages and dividing by the total number of dooming or grooming events. *P = 0.01, **P = 0.0057. Data were analyzed using an unpaired Student’s t test. For (F) and (G), data points represent an image embryo. n = 10 from three independent experiments. |
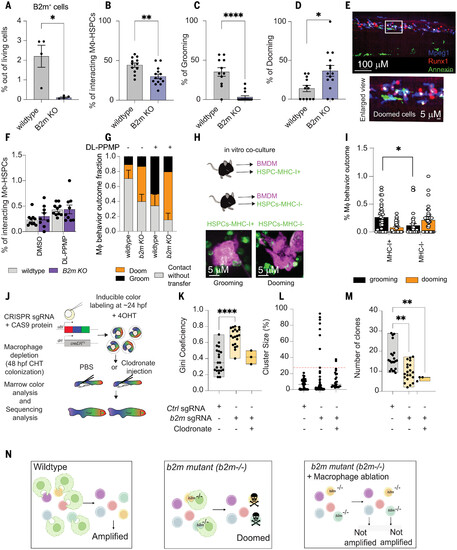
B2m acts as a “don’t eat-me” molecule and prevails unwarranted HSPC dooming. (A) b2m knock-out stable mutants (B2m KO) showed a significant reduction in B2M levels. Data were analyzed by unpaired Mann-Whitney U test. *P = 0.028. Data points represent a pool of 100 embryos. (B) Barplot showing the interaction percentage. (C and D) b2m KO embryos showed significantly lower macrophage-HSPC interaction with a dooming dominance. Data were analyzed by unpaired Mann-Whitney test. *P = 0.012, **P = 0.0021, ****P < 0.0001. Data points represent an image embryo. WT, n = 12; B2m KO, n = 14. Data represent three independent experiments. The macrophage-HSPC interaction percentage was calculated by counting the total number of HSPCs (runx1+ cells) and dividing by the total number of HSPCs interacting with a macrophage. (E) Representative imaging showing the increased dooming behavior observed in the B2m-homozygous mutant. n = 4 from two independent experiments. (F) Bar plot showing the interaction rates in WT and B2m KO zebrafish embryos. n = 4. Data points depict the field of view. (G) The macrophage behavior percentage outcome was calculated by counting the total number of interacting macrophages and dividing by the total number of dooming or grooming events. Whereas in the WT background DL-PPMP promoted grooming, in the B2m KO background, it promoted dooming. (H) Schematic overview of the murine HSPCs (LSK+) and macrophage co-culture. Left bottom panel is a representative imaging showing the sorted murine HSPC-MHC-I+ (green) being groomed by a macrophage (magenta). Right bottom panel is a murine HSPC-MHC-I– being doomed by a macrophage. (I) MHC-I+ HSPCs showed higher grooming rates compared with MHC-I– cells. Data were analyzed using nonparametric one-way ANOVA followed by Kruskall Wallis test. *P = 0.03. Data are shown as means ± SEM. The macrophage behavior outcome fraction was calculated by counting the total number of interacting macrophages and dividing by the total number of dooming or grooming events. (J) Schematic overview of the Zebrabow-M system. Animals with 15 to 20 insertions of a multicolor fluorescent cassette were crossed to the draculin:CreERT2 line to enable clonal labeling of lateral plate mesoderm lineages. By treating with 4-OHT at 24 hpf, just after HSC specification, individual stem cell lineages expressing specific fluorescent hues can be quantified in the adult marrow. (K) Families of Zebrabow-M;draculin:CreERT2 animals injected with b2m morpholino with or without clodronate liposomes exhibited reduced numbers of HSC clones. (L and M) Clonal dominance in the adult marrow. Clodronate liposome was injected at 48 hpf. Data points represent an adult kidney marrow. Control, n = 22; b2m sgRNA, n = 21; and clodronate, n = 3. Experiments were conducted at least twice. For (A) to (D), (F), (G), and (I), and (K) to (M), data are shown as means ± SEM. Experiments were conducted in vivo using zebrafish as a model. (N) Schematic overview of the clonal diversity in regard to the “don’t eat-me” signal. |
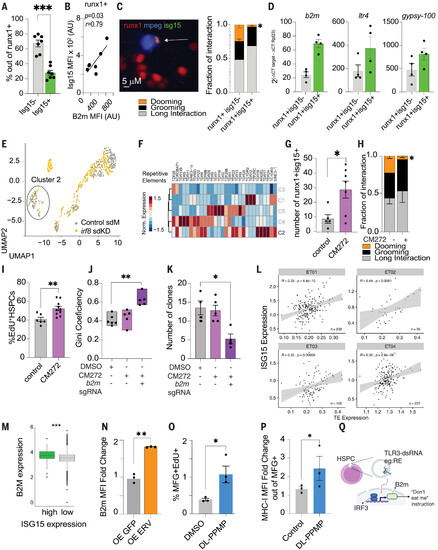
REs as Erv elicit a virus-like response in HSPCs promoting B2m expression. (A) Flow cytometry showing that ~20% of runx1+23mCherry+ HSPCs express Isg15 (gating strategy is shown in fig. S4A). Data points represent a pool of ~200 embryos acquired in three independent experiments. Data are shown as means ± SEM. Data were analyzed with Mann-Whitney test. P = 0.003. (B) Positive correlation between B2m and Isg15 levels. Data were analyzed by Pearson correlation. Data points represent a pool of ~200 embryos acquired in three independent experiments. (C) Left: representative image of a Isg15+-HSPC interaction. HSPCs are shown in red, macrophages in blue, and isg15 in green. Right: HSPCs-Isg15+ cells showing lower dooming ratios. (D) Sorted isg15+ HSPCs showing higher b2m and RE expression. Data points represent a pool of ~200 embryos. Experiments were performed twice. The y axis depicts the relative gene expression. (E) Uniform manifold and projection (UMAP) of sorted runx1+23-mcherry HSPCs in standard morpholino (gray, control sdM) and irf8-depleted embryos (yellow, irf8 sdKD). [Original data are from Wattrus et al. (6)]. (F) Cluster 2 (C2), enriched for control HSPCs, showing higher expression of RE. A total of 808 cells were analyzed. (G) Treating 2-dpf embryos with CM272 (5 uM) led to higher number of isg15+HSPCs in the 3-dpf CHT. Data were quantified by live-cell imaging and analyzed by Mann-Whitney test. *P = 0.02. Data points represent an embryo. Experiments were performed twice. (H) EdU staining of runx1+23:mCherry embryos treated with CM272 identifies a significant increase in proliferating HSPCs at 3 dpf. Data were analyzed by Student’s t test. Data normality was enquired by the Shapiro-Wilk test. **P = 0.0061. Data are shown as means ± SEM. Control, n = 5; CM272, n = 7. (I) CM272-treated embryos showed lower dooming ratios. Data points represent an embryo. Percentage was calculated by quantification of Edu+ Runx1+ cells divided by the total number of runx1+ cells. The plot depicts two independent experiments. Control, n = 6; CM272, n = 10. (J) Gini coefficient in control (DMSO), CM272, and CM272 b2m-knockdown zebrafish. Data were analyzed by Kruskall-Wallis test followed by Dunn’s multiple-comparisons test. **P = 0.0043. Data points represent an adult fish. DMSO, n = 6; CM272, n = 5; and b2m sgRNA, n = 5. The plot depicts two independent experiments. (K) b2m-TWISTR Zebrabow-M;draculin:CreERT2 treated CM272 exhibits reduced numbers of HSC clones in the adult marrow. Data were analyzed by Kruskall-Wallis test followed by Dunn’s multiple-comparisons test. *P = 0.023. Data points represent an adult fish. DMSO, n = 6; CM272, n = 5; and b2m sgRNA, n = 5. The plot shows two independent experiments. (L) ISG15 expression positively correlates with transposable element (TE) expression in human HSCs. Previously published single-cell RNA-seq datasets of human bone marrow CD34+ stem and progenitors [original data from Nam et al. (90), n = 4 samples] were aligned to a TE reference using CellRanger v3.2. TE expression was normalized by total RNA counts. Pearson correlation was performed between TE expression and ISG15 gene expression of individual HSCs, represented in each data point. (M) Human bone marrow HSCs from the same dataset as in (L) were grouped based on their ISG15 expression, where in the upper quartile was considered the threshold for high and the lower quartile as low. Normalized expression of B2M is shown for individual cells. ISG15 high cells showed higher B2M expression. Only cells with at least one transcript of ISG15 were included in the analysis. High, n = 203 cells; low, n = 608 cells from n = 4 samples. P = 0.02 using a linear mixed model, with sample as a random effects variable. Box plot represents the median; in the bottom and top quartiles, whiskers correspond to 1.5× the interquartile range. (N) Human Erv overexpression was up-regulated the B2M levels on human CD34+ cells. Data are shown as means ± SEM. Data points depict a CD34 donor. Data were collected from two independent donors. (O) EdU staining of MFG+ mice treated with DL-PPMP identifies an increase in proliferating HSPCs 24 hours after the treatment. Percentage was determined by the total number of living cells. Data points depict a mouse. (P) DL-PPMP treatment stimulates B2M expression in murine HSPCs. Flow cytometry was performed using the cells from the tibia and femur (for gating, see fig. S4Q). Data were analyzed by Student’s t test. *P = 0.02. Data are shown as means ± SEM. n = 3 mice per condition. (Q) Schematic overview of the proposed molecular pathway resulting in higher surface B2m. |