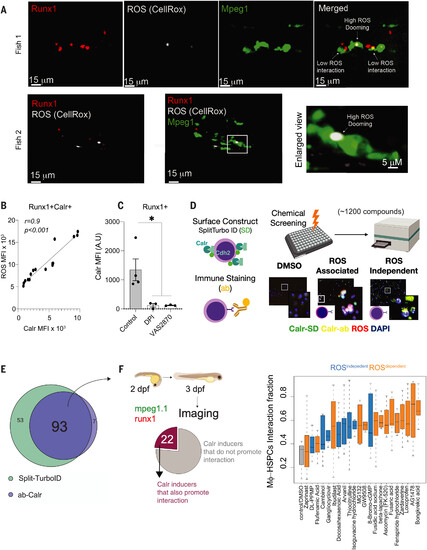
Fig. 1
- ID
- ZDB-FIG-240913-28
- Publication
- Pessoa Rodrigues et al., 2024 - Transcripts of repetitive DNA elements signal to block phagocytosis of hematopoietic stem cells
- Other Figures
- All Figure Page
- Back to All Figure Page
|
Chemical screen identifies ROS-dependent and ROS-independent surface Calr inducers. (A) Representative imaging from three independent experiments showing that ROS+Runx1+ cells are preferentially doomed by the macrophages. Green indicates Mpeg; red, Runx1; and white, the CellRox probe. (B) ROS levels in embryonic HSPCs marked by surface Calr. Data were analyzed by Pearson correlation. MFI, median fluorescence intensity; AU, arbitrary unit. Data points represent a pool of 100 to 300 3-dpf embryos (C) Surface Calr levels on HSPCs after ROS inhibition with DPI or VAS2870 (a Nox inhibitor). Data were analyzed by Kruskall-Wallis test followed by Dunn’s test; *P < 0.05. Data points represent a pool of 100 to 300 3-dpf embryos. Data in (A) to (C) are shown as means ± SEM. Experiments were performed in a pool of 100 to 300 zebrafish embryos in two independent experiments. (D) Schematic overview of the chemical screen. Two approaches were used to ensure that our system specifically recorded the surface Calr values: (i) HEK293 cells were transfected with the SPLIT-TURBO ID where the C terminus was designed to carry Cdh2, a membrane protein, whereas the N terminus was carrying Calr; and (ii) anti-Calr was conjugated with a A647 using Zenon technology. Next, the cells were plated in 384-well plates and treated with a panel of 1200 bioactive small molecules in three different concentrations, 5, 2.5, and 0.625 μM. The cells were also labeled with a ubiquitous ROS probe (CellRox) and DAPI for nuclear staining. After 24 hours, the Zeiss Cell Discoverer 7 (CR7) microscope was used to read the plates. Data were analyzed using the CellProfiler and R-Sight HTS software. SD, Split-turbo ID; ab, Calr antibody. (E) Numbers and overlap in compounds that induced surface Calr in HEK293 for both systems. Each compound was tested in replicates, and two to four random fields of view were chosen for acquisition. The same well was used for SPLIT-Turbo, Ab-Calr, and CellROX acquisition. (F) Left: number of compounds that increased surface Calr in vitro and in vivo (zebrafish embryos). Right: live image microscopy was used to determine the interaction fraction between macrophage-HSPCs using mpeg-GFP;runx1-mCherry embryos that label macrophage and HSPCs, respectively. Highlighted in blue are the ROS-independent compounds, and black represents the ROS-dependent compounds. Data are shown are means ± SEM. The zebrafish live-imaging experiments performed to determine the macrophage-HSPC interaction were conducted as two independent experiments, and a minimum of five embryos were imaged. |

