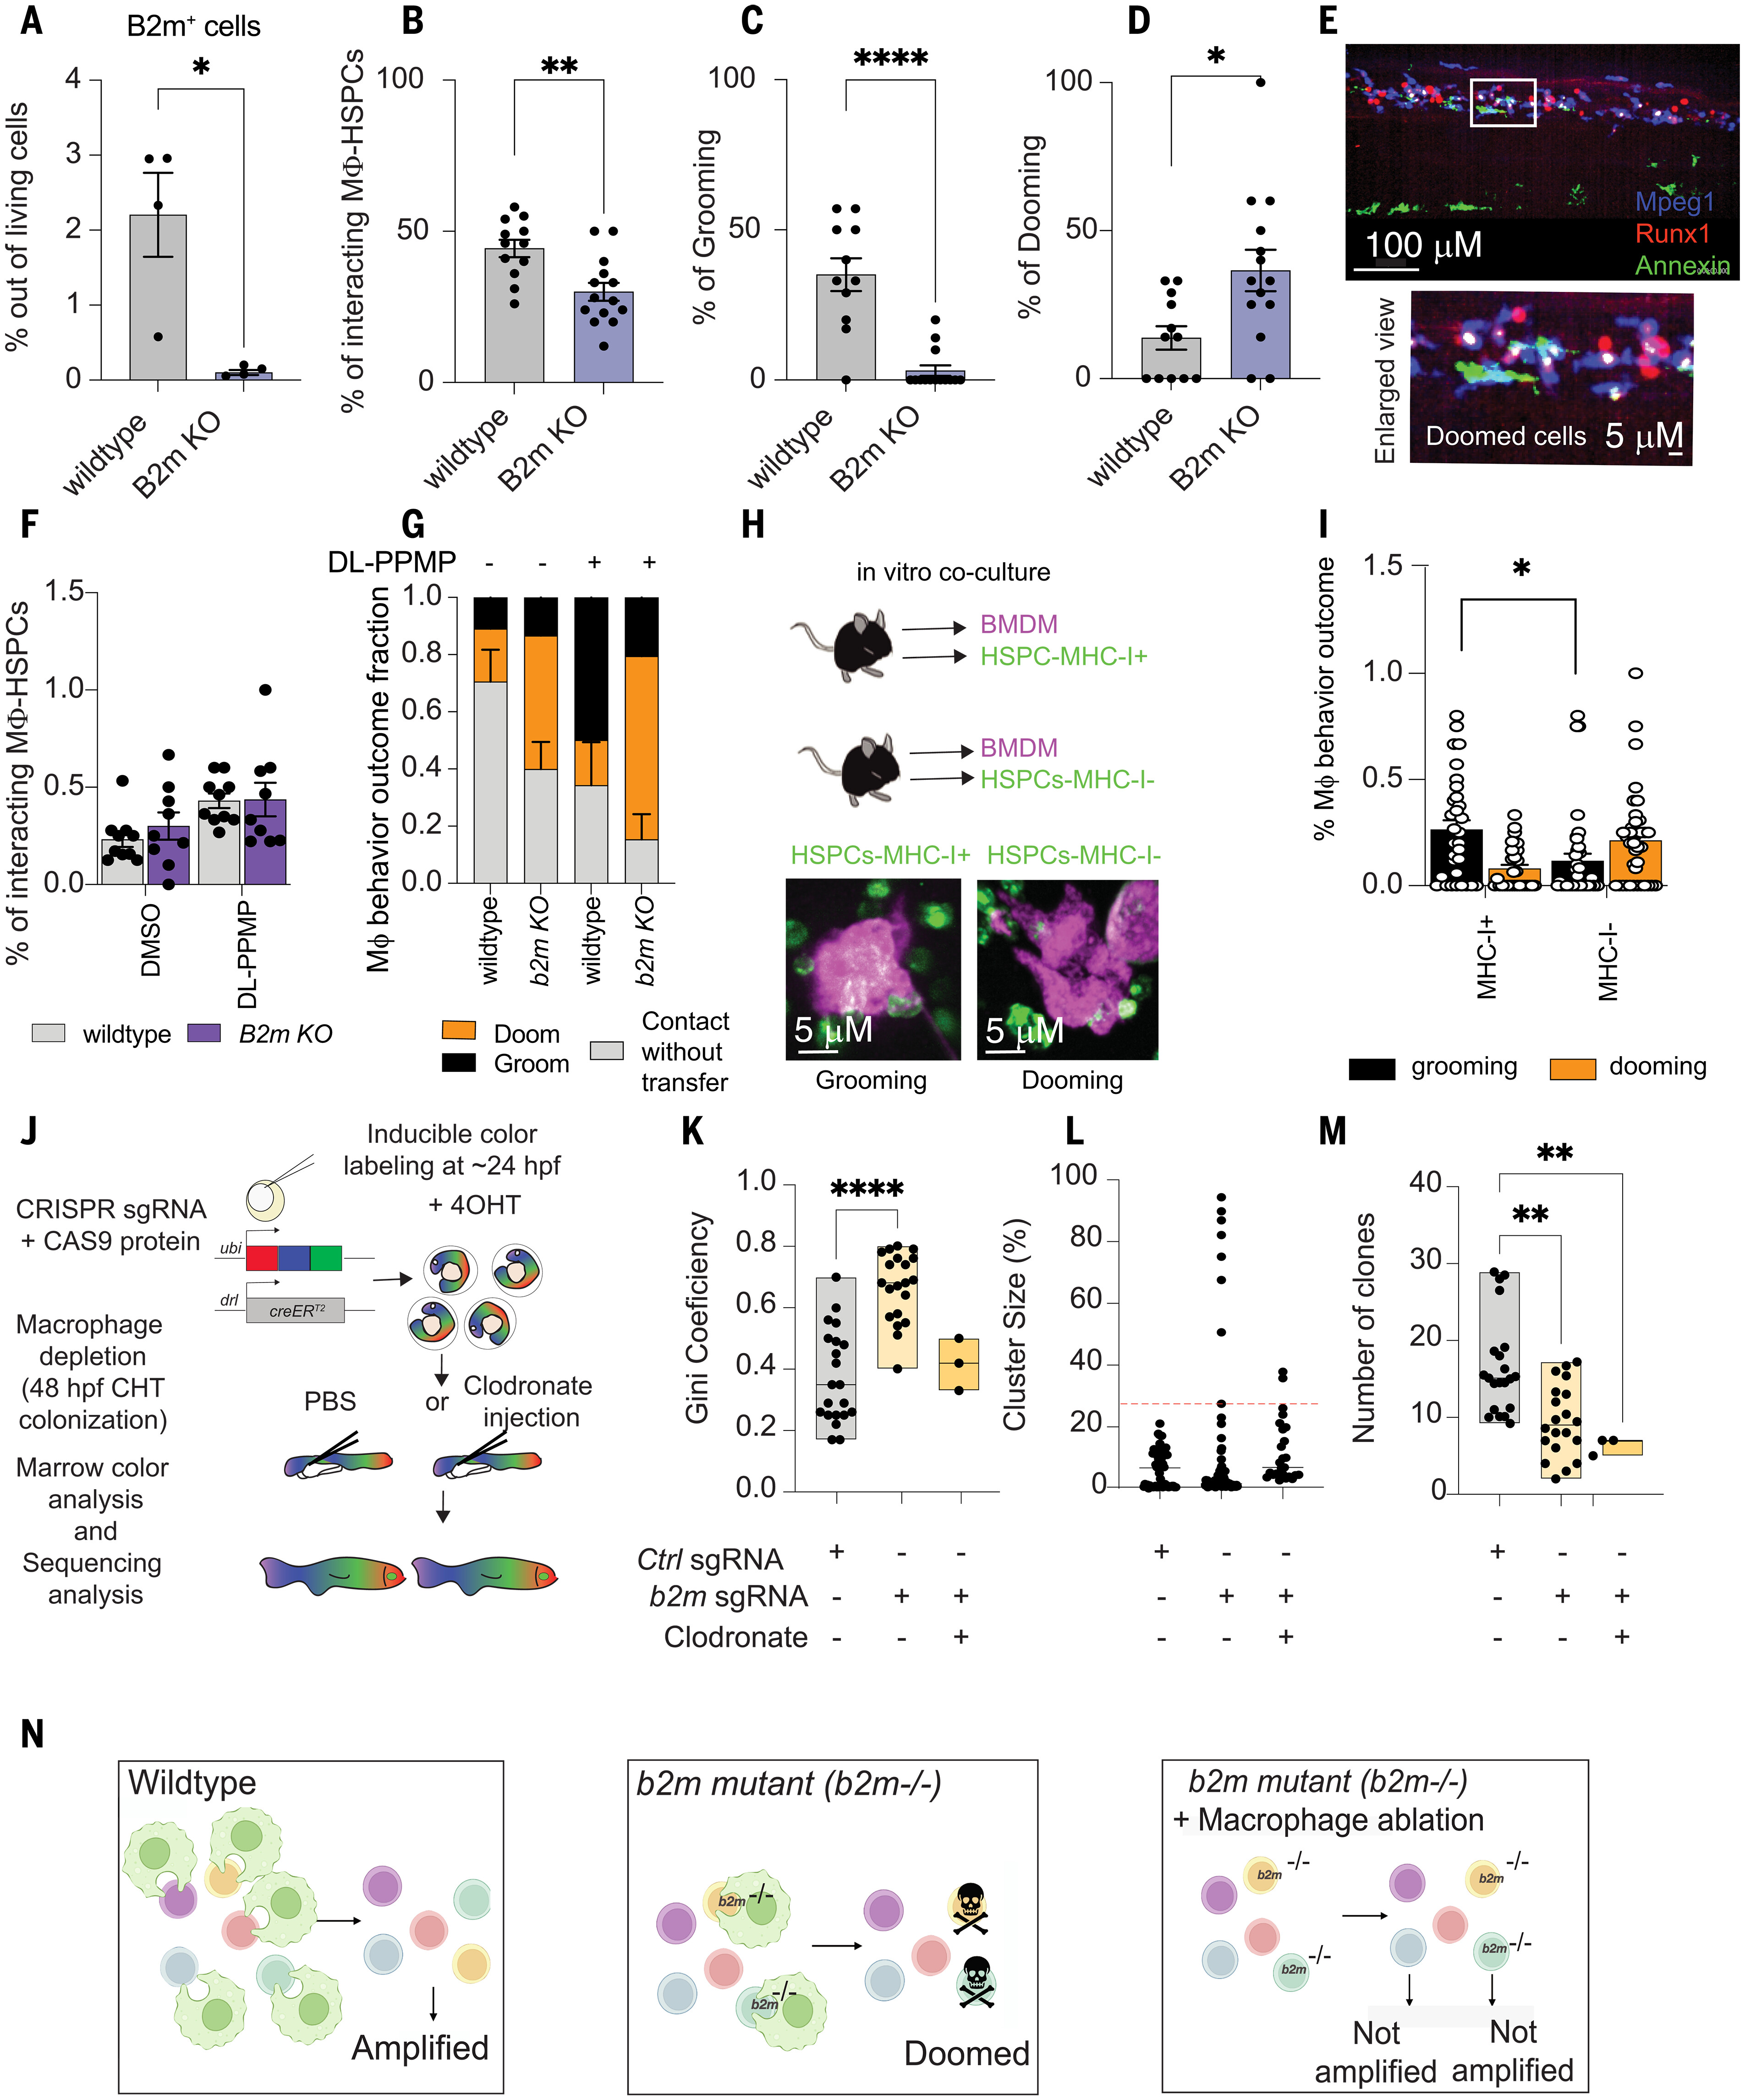
Fig. 3 B2m acts as a “don’t eat-me” molecule and prevails unwarranted HSPC dooming. (A) b2m knock-out stable mutants (B2m KO) showed a significant reduction in B2M levels. Data were analyzed by unpaired Mann-Whitney U test. *P = 0.028. Data points represent a pool of 100 embryos. (B) Barplot showing the interaction percentage. (C and D) b2m KO embryos showed significantly lower macrophage-HSPC interaction with a dooming dominance. Data were analyzed by unpaired Mann-Whitney test. *P = 0.012, **P = 0.0021, ****P < 0.0001. Data points represent an image embryo. WT, n = 12; B2m KO, n = 14. Data represent three independent experiments. The macrophage-HSPC interaction percentage was calculated by counting the total number of HSPCs (runx1+ cells) and dividing by the total number of HSPCs interacting with a macrophage. (E) Representative imaging showing the increased dooming behavior observed in the B2m-homozygous mutant. n = 4 from two independent experiments. (F) Bar plot showing the interaction rates in WT and B2m KO zebrafish embryos. n = 4. Data points depict the field of view. (G) The macrophage behavior percentage outcome was calculated by counting the total number of interacting macrophages and dividing by the total number of dooming or grooming events. Whereas in the WT background DL-PPMP promoted grooming, in the B2m KO background, it promoted dooming. (H) Schematic overview of the murine HSPCs (LSK+) and macrophage co-culture. Left bottom panel is a representative imaging showing the sorted murine HSPC-MHC-I+ (green) being groomed by a macrophage (magenta). Right bottom panel is a murine HSPC-MHC-I– being doomed by a macrophage. (I) MHC-I+ HSPCs showed higher grooming rates compared with MHC-I– cells. Data were analyzed using nonparametric one-way ANOVA followed by Kruskall Wallis test. *P = 0.03. Data are shown as means ± SEM. The macrophage behavior outcome fraction was calculated by counting the total number of interacting macrophages and dividing by the total number of dooming or grooming events. (J) Schematic overview of the Zebrabow-M system. Animals with 15 to 20 insertions of a multicolor fluorescent cassette were crossed to the draculin:CreERT2 line to enable clonal labeling of lateral plate mesoderm lineages. By treating with 4-OHT at 24 hpf, just after HSC specification, individual stem cell lineages expressing specific fluorescent hues can be quantified in the adult marrow. (K) Families of Zebrabow-M;draculin:CreERT2 animals injected with b2m morpholino with or without clodronate liposomes exhibited reduced numbers of HSC clones. (L and M) Clonal dominance in the adult marrow. Clodronate liposome was injected at 48 hpf. Data points represent an adult kidney marrow. Control, n = 22; b2m sgRNA, n = 21; and clodronate, n = 3. Experiments were conducted at least twice. For (A) to (D), (F), (G), and (I), and (K) to (M), data are shown as means ± SEM. Experiments were conducted in vivo using zebrafish as a model. (N) Schematic overview of the clonal diversity in regard to the “don’t eat-me” signal.
Image
Figure Caption
Acknowledgments
This image is the copyrighted work of the attributed author or publisher, and
ZFIN has permission only to display this image to its users.
Additional permissions should be obtained from the applicable author or publisher of the image.
Full text @ Science

