
- Title
-
Schwann cell transient receptor potential ankyrin 1 (TRPA1) ortholog in zebrafish larvae mediates chemotherapy-induced peripheral neuropathy
- Authors
- Bellantoni, E., Marini, M., Chieca, M., Gabellini, C., Crapanzano, E.L., Souza Monteiro de Araujo, D., Nosi, D., Roschi, L., Landini, L., De Siena, G., Pensieri, P., Mastricci, A., Scuffi, I., Geppetti, P., Nassini, R., De Logu, F.
- Source
- Full text @ Br. J. Pharmacol.

AITC and 4-HNE promote nociceptive-like behaviour in zebrafish larvae via TRPA1. (a,b) Typical traces, concentration–response curve and cumulative data of calcium responses in zTRPA1b-HEK293T cells stimulated with AITC, 4-HNE or vehicle (Veh) and in the presence of A-967079 (A96, 30 μM) (cell numbers: AITC: 1 nM n = 96, 10 nM n = 75, 100 nM n = 112, 1 μM n = 70, 3 μM n = 111, 10 μM n = 94, 100 μM n = 80, 1 mM n = 84, A96 = 85, Veh = 44; n = 3 independent experiments) (cell numbers: 4-HNE: 300 nM n = 56, 1 μM n = 52, 3 μM n = 90, 10 μM n = 77, 30 μM n = 80, 100 μM n = 98, 300 μM n = 92, 1 mM n = 64, A96 = 88, Veh = 77). (c–f) Typical traces and cumulative data of the locomotor activity of 5 days post fertilization (dpf) zebrafish larvae exposed to AITC (0.01–0.1–1–10 μM), 4-HNE (1–10–100 μM) or Veh and in the presence of A96 (10 μM) (n = 8–16 larvae per group). (g,h) Typical images and dose-dependent writhing behaviour in 24–27 post fertilization (hpf) zebrafish larvae exposed to AITC (50–100–500 μM), 4-HNE (100–500 μM, 1 mM) or Veh and in the presence of A96 (30 μM) (n = 60 larvae per group). (i,j) Typical images and dose-dependent light touch response in 24–27 hpf zebrafish larvae exposed to AITC (50–100–500 μM), 4-HNE (100–500 μM, 1 mM) or Veh and in the presence of A96 (30 μM) (n = 60 larvae per group). Mean ± SEM. *P < 0.05; #P < 0.05, one-way ANOVA and Bonferroni post hoc test. |

H2O2 induces nociceptive-like behaviour in zebrafish larvae via TRPA1. (a) Typical traces, concentration–response curve and cumulative data of calcium responses in zTRPA1b-HEK293T cells exposed to H2O2 or vehicle (Veh) and in the presence of A-967079 (A96, 30 μM) (cell numbers: H2O2: 3 μM n = 120, 10 μM n = 93, 30 μM n = 78, 100 μM n = 81, 300 μM n = 90, 1 mM n = 83, 3 mM n = 90, 10 mM n = 99, A96 = 110, Veh = 77). (b,c) Typical traces and cumulative data of the locomotor activity of 5 days post fertilization (dpf) zebrafish larvae exposed to H2O2 (100–500 μM, 1 mM) or Veh and in the presence of A96 (10 μM) (n = 8–15 larvae per group). (d) Typical images and dose-dependent writhing behaviour in 24–27 post fertilization (hpf) zebrafish larvae exposed to H2O2 (30–100–300 mM) or Veh and in the presence of A96 (30 μM) (n = 60 larvae per group). (e) Typical images and dose-dependent light touch response in 24–27 hpf zebrafish larvae exposed to H2O2 (30–100–300 mM) or Veh and in the presence of A96 (30 μM) (n = 60 larvae per group). Mean ± SEM. *P < 0.05; #P < 0.05 one-way ANOVA and Bonferroni post hoc test. |

Oxaliplatin increases oxidative stress, which targets TRPA1 to induce nociceptive behaviour and calcium response. (a) Schematic representation of zebrafish larvae body section and representative images of the lateral view of 5 days post fertilization (dpf) zebrafish larvae stained with anti-acetylated tubulin (α-tubulin) and cumulative data of axon branch density following exposure to oxaliplatin (Oxa, 1–10 μM) or vehicle (Veh) (n = 6 larvae per group). (b) Typical traces and cumulative data of the locomotor activity of 5 dpf zebrafish larvae exposed to Oxa (1–10 μM). (c) Schematic representation of zebrafish larvae body section and representative images of the lateral view of 5 dpf zebrafish larvae injected with Hyper7 mRNA at one-cell stage and cumulative data of HyPer ratio (YFP500/YFP400) fluorescence following exposure to Oxa (10 μM) or Veh and in the presence of reduced glutathione (GSH, 10 μM) (n = 6 larvae per group). (d) Typical traces and cumulative data of the locomotor activity of 5 dpf zebrafish larvae exposed to Oxa (10 μM) or Veh and in the presence of GSH (10 μM) (n = 13–16 larvae per group). (e) Schematic representation of zebrafish larvae body section and representative images of the lateral view of 5 dpf zebrafish larvae injected with Hyper7 mRNA at one-cell stage and cumulative data of HyPer ratio (YFP500/YFP400) fluorescence following exposure to Oxa (10 μM) or Veh and in the presence of A-967079 (A96, 1 μM) (n = 6 larvae per group). (f) Typical traces and cumulative data of locomotor activity of 5 dpf zebrafish larvae exposed to Oxa (10 μM) or Veh and in the presence of A96 (10 μM) (n = 16 larvae per group). (g–i) Typical traces and cumulative data of the locomotor activity of 5 dpf exposed to a subthreshold dose of H2O2 (100 μM) and AITC (0.01 μM) or Veh following incubation with a subthreshold dose of Oxa (1 μM) or Veh and in the presence of A96 (10 μM) or GSH (10 μM) (n = 16 larvae per group). (j) Cumulative data of the calcium response evoked by subthreshold concentration of H2O2 (30 μM) in zTRPA1b-HEK293T cells pre-incubated with Oxa (300 μM) or Veh in the absence or presence of A96 (30 μM) or GSH (30 μM) (cell numbers: Veh-Veh n = 83, Veh-H2O2 n = 78, Veh-Oxa n = 111, Oxa-H2O2 n = 129, Oxa-H2O2-A96 n = 156, Oxa-H2O2-GSH n = 148; n = 3 independent experiments). Mean ± SEM. *P < 0.05, #P < 0.05, one-way ANOVA and Bonferroni post hoc test. |
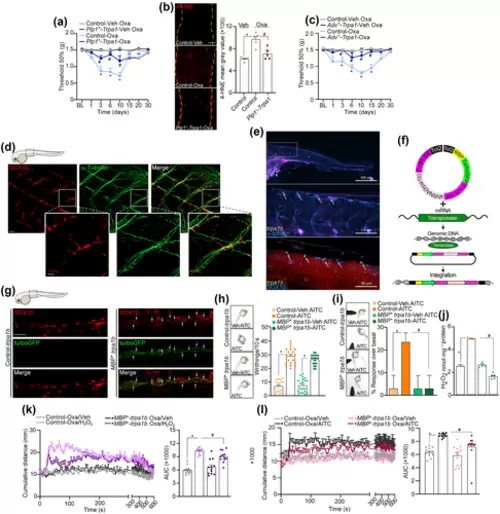
Schwann cell TRPA1 modulates painful behaviours in oxaliplatin-induced CIPN. (a) Time-dependent mechanical allodynia induced by oxaliplatin (Oxa, 3 mg·kg−1, i.p.) or vehicle (Veh) in Plp1+-Trpa1 and control mice (n = 8 animals per group). (b) Representative images and cumulative data of 4-HNE immunostaining in mouse sciatic nerve tissue in Plp1+-Trpa1 and control mice after Oxa (3 mg·kg−1, i.p.) or Veh (scale bar: 50 μm) (n = 5 animals per group, yellow dashes represent the edge of sciatic nerve). (c) Time-dependent mechanical allodynia induced by oxaliplatin (Oxa, 3 mg·kg−1, i.p.) or Veh in Adv+-Trpa1 and control mice (n = 8 animals per group). (d) Schematic representation of zebrafish larvae body section and representative images of the lateral view of 5 days post fertilization (dpf) zebrafish larvae stained with anti-acetylated tubulin (α-tubulin, axons marker) and SOX10 (Schwann cells marker) (scale bar: 20 μm). (e) Representative images of the lateral view of RNAscope images of TRPA1b mRNA, SOX10 and α-tubulin in 5 dpf zebrafish larvae. (f) Schematic representation of pTol2-MBP-TurboGFP-dre-trpa1_b[shRNA] plasmid. (g) Schematic representation of zebrafish larvae body section and representative images of SOX10 immunostaining and turbo GFP protein in 5 dpf MBP−-trpa1b zebrafish larvae (scale bar: 10 μm). (h,i) Writhing behaviour and light touch response in 24–27 post fertilization (hpf) MBP+-trpa1b or control zebrafish larvae exposed to AITC (500 μM) or Veh (n = 20 larvae per group). (j) H2O2 levels in 5 dpf MBP+-trpa1b or control zebrafish larvae homogenates exposed to AITC (10 μM) or Veh (n = 5 larvae per group). (k,l) Time-dependent and cumulative data of the locomotor activity of 5 dpf MBP+-trpa1b or control zebrafish larvae exposed to a subthreshold dose of H2O2 (100 μM) and AITC (0.01 μM) or Veh following incubation with a subthreshold dose of Oxa (1 μM) (n = 12 larvae per group). Mean ± SEM. *P < 0.05 (vs. Control-Veh-Oxa in a); #P < 0.05 (vs. Control-Oxa in a) one-way and two-way ANOVA and Bonferroni post hoc test. |