FIGURE SUMMARY
Title

MRAP2a Binds and Modulates Activity and Localisation of Prokineticin Receptor 1 in Zebrafish

Authors
Fullone, M.R., Maftei, D., Vincenzi, M., Lattanzi, R., Miele, R.
Source
Full text @ Int. J. Mol. Sci.

mrap2a and mrap2b genes of the zebrafish. (A) Schematic representation of zebrafish mrap2a and mrap2b genes and human mrap2 and mouse mrap2 genes. The coding exons are shown in black bars and the untranslated sequences are shown in white bars (B). Synteny analysis of human mrap2 and mouse mrap2 and mrap2a and mrap2b genes in zebrafish. Locus data are from the Ensembl database. RIPPLY2, ripply transcriptional repressor 2 (human, gene ID: 134701; mouse, gene ID: 382089; zebrafish, gene ID: 654447). cep162, centrosomal protein 162 (human; mouse; zebrafish, gene ID: 562035). sim1b, SIM bHLH transcription factor 1b (zebrafish, gene ID: 566656), selenbp1, selenium-binding protein 1 (zebrafish, gene ID: 393542); plekho1b, pleckstrin homology domain containing, family O member 1b (zebrafish, gene ID: 562940). pi4kb, phosphatidylinositol 4-kinase, catalytic, beta (zebrafish, Gene ID: 563201).

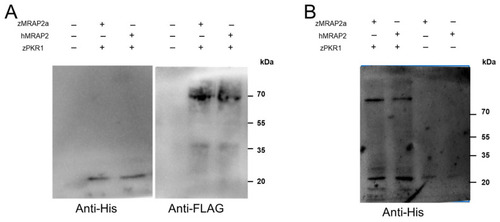
Interaction of zMRAP2a and hMRAP2 isoforms with zPKR1. (A) Detection of the interaction of zMRAP2a with the zPKR1 by immunoprecipitation. Membrane proteins immunoprecipitated with FLAG binding resin were resolved by SDS-PAGE. Immunoblots were probed with anti-His and anti-FLAG antibodies. (B) Crosslinking of zPKR1 with hMRAP2 and zMRAP2a. CHO cells expressing zPKR1 and zMRAP2a or hMRAP2 were incubated with dithiobis (succinimidyl propionate).

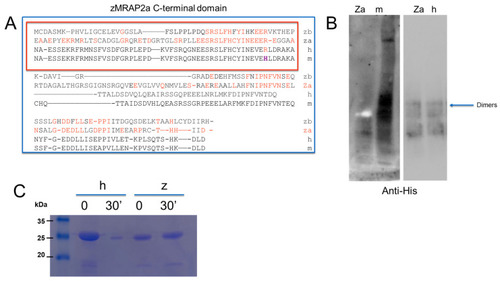
Biochemical analysis of the zCT-MRAP2a domain. (A) Alignments of the C-terminal domain of human (h), mouse (m) and zebrafish (za, zb) MRAP2. The alignment of the region important for the interaction of MRAP2 with PKRs is shown in the red box. In red the amino acids that are conserved in zebrafish and mouse with respect to hPKR1 and hPKR2. In purple indicates an amino acid that is present in mice and is important for the conformation of the protein [35]. (B) Blue native PAGE of the C-terminal domains of human (h), mouse (m), and zebrafish (za) MRAP2 expressed in E. coli. (C) SDS-PAGE analysis of hCT-MRAP2 and zCT-MRAP2, limited time course of proteolysis.

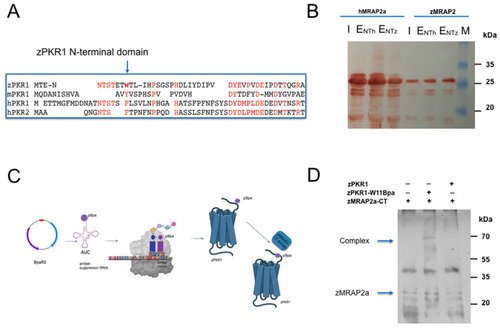
Role of N-Terminal region of zPKR1 for zMRAP2a and hMRAP2 interaction. (A) Alignments of the hPKR1, hPKR2, mPKR1 and zPKR1 N-terminal sequence. In red the amino acids that are conserved in zebrafish and mouse with respect to hPKR1 and hPKR2, in bold the amino acid that was replaced by photoreactive p-benzoyl-L-phenilalanine. (B) GST pull-down experiments. The zPKR1-NT-GST and hPKR1-NT-GST were used to pull down CT-domains of zebrafish zMRAP2a and of hMRAP2. The eluate obtained using zPKR1-NT-GST (ENTz) and eluate obtained using hPKR1-NT-GST(ENTh) were analysed by Western blotting analysis with anti-His antibody. The negative control (EGST) was obtained using GST to pull down zMRAP2a. (C) Schematic representation of the amber codon suppression technology for genetic introduction of the photoreactive p-benzoyl-L-phenilalanine (pBpa) directly into expressed zPKR1 in a yeast cell system. (D) Crosslinking of zPKR1-WT and the zPKR1-W11Bpa with zCT-MRAP2a domain. Membranes prepared from P. pastoris cells expressing the zPKR1-W11Bpa and zPKR1-WT were incubated with zCT-MRAP2a domain. The membrane proteins were immunoblotted and analysed with anti-His antibodies.

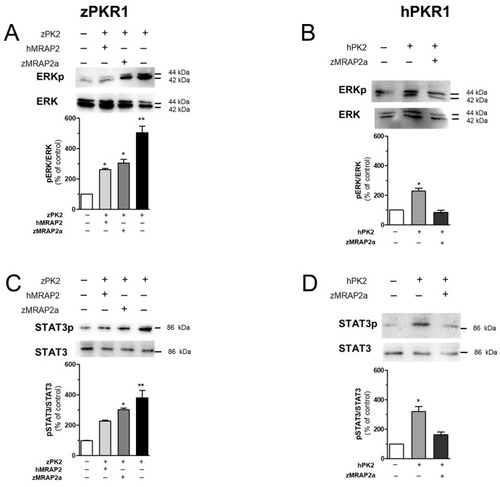
Analysis of ERK and STAT3 activation in CHO cells. (A,B) Analysis of ERK1/2 phosphorylation in CHO cells transfected with zPKR1 or hPKR1. Densitometric plots show pERK1/2 and ERK1/2 protein levels 10 min after treatment with zPK2 or hPK2 (100 nM). The bar graphs show the pERK1/2/ERK1/2 ratio and the percentage increase compared to unstimulated cells (CTRL). (C,D) Densitometric plots show phospho-STAT3 (pSTAT3) and STAT3 protein levels in CHO cells expressing zPKR1 or hPKR1 after 1 h of treatment with zPK2 or hPK2 (100 nM). Data are presented as the ratio of pSTAT3 to total STAT3 protein and plotted as a percentage increase compared to CTRL. The bars show the mean values ± SEM of the three experimental conditions. For statistical analysis, a one-way ANOVA followed by Tukey’s test for multiple comparisons was used. * p < 0.05, ** p < 0.01 versus CTRL.

(A) Representative immunofluorescence images of CHO cells transfected with zPKR1-GFP (green) and zMRAP2a or hMRAP2. (B) Representative immunofluorescence images of CHO cells transfected with hPKR1-GFP (green) and zMRAP2a or hMRAP2. Scale bar 10 μm. The cell nuclei were counterstained with DAPI (blue).

Acknowledgments
This image is the copyrighted work of the attributed author or publisher, and ZFIN has permission only to display this image to its users. Additional permissions should be obtained from the applicable author or publisher of the image. Full text @ Int. J. Mol. Sci.