IMAGE

Figure 4

ID
ZDB-IMAGE-240729-191
Source
Figures for Fullone et al., 2024
Image
Figure Caption

Figure 4

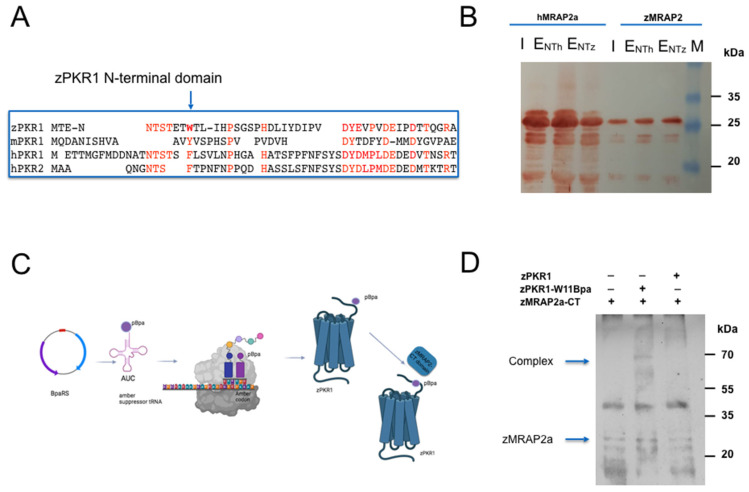
Role of N-Terminal region of zPKR1 for zMRAP2a and hMRAP2 interaction. (A) Alignments of the hPKR1, hPKR2, mPKR1 and zPKR1 N-terminal sequence. In red the amino acids that are conserved in zebrafish and mouse with respect to hPKR1 and hPKR2, in bold the amino acid that was replaced by photoreactive p-benzoyl-L-phenilalanine. (B) GST pull-down experiments. The zPKR1-NT-GST and hPKR1-NT-GST were used to pull down CT-domains of zebrafish zMRAP2a and of hMRAP2. The eluate obtained using zPKR1-NT-GST (ENTz) and eluate obtained using hPKR1-NT-GST(ENTh) were analysed by Western blotting analysis with anti-His antibody. The negative control (EGST) was obtained using GST to pull down zMRAP2a. (C) Schematic representation of the amber codon suppression technology for genetic introduction of the photoreactive p-benzoyl-L-phenilalanine (pBpa) directly into expressed zPKR1 in a yeast cell system. (D) Crosslinking of zPKR1-WT and the zPKR1-W11Bpa with zCT-MRAP2a domain. Membranes prepared from P. pastoris cells expressing the zPKR1-W11Bpa and zPKR1-WT were incubated with zCT-MRAP2a domain. The membrane proteins were immunoblotted and analysed with anti-His antibodies.

Acknowledgments
This image is the copyrighted work of the attributed author or publisher, and ZFIN has permission only to display this image to its users. Additional permissions should be obtained from the applicable author or publisher of the image. Full text @ Int. J. Mol. Sci.