
- Title
-
Zebrafish models of candidate human epilepsy-associated genes provide evidence of hyperexcitability
- Authors
- LaCoursiere, C.M., Ullmann, J.F.P., Koh, H.Y., Turner, L., Baker, C.M., Robens, B., Shao, W., Rotenberg, A., McGraw, C.M., Poduri, A.H.
- Source
- Full text @ iScience
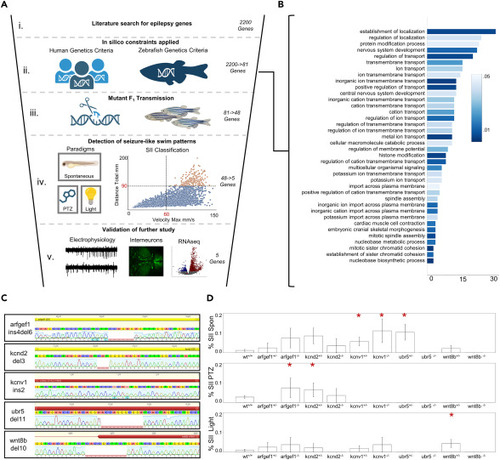
Overview of evaluation of candidate human epilepsy genes in zebrafish models (A) Graphical depiction of primary F2 screening method including: (i) initial gene identification through literature search; (ii) application of in silico constraints; (iii) generation of initial crispants and stable F2 mutants; (iv) detection of seizure-like swim patterns in either a spontaneous, light-provoked, or subthreshold PTZ assay; and (v) characterization of mutant lines that displayed SII seizure events via local field potentials, quantifying dlx-GFP expressing inhibitory interneurons and RNA-seq. (B) 48 genes for which we generated surviving crispants and stable mutant lines represent heterogeneous Gene Ontology (GO) categories of biological processes. (C) Schematic of homozygous mutations found in the five genes meeting criteria for positive seizure-like swim patterns. (D) Results from three paradigms suggesting hyperexcitability based on swim patterns. Paradigms included a 1h spontaneous recording, a light provoked recording and a subthreshold PTZ provoked paradigm. Mutant larvae exhibited limited SI-like behavior as shown by mean velocity, but 5 mutant alleles showed an increase in the proportion of larvae with at least one SII event. Statistical significance for SI behavior was determined by Kruskal-Wallis tests with Dunn multiple comparisons while significance of SII events was determined by the binomial probability of SII events compared to the expected value from the population proportion. Significance was determined within a 95% confidence interval, ∗p < 0.05, ∗∗p < 0.01, ∗∗∗p < 0.001. Data are represented as proportional mean ± STD. Candidate gene list and information available in Table S1 . Behavior n per gene and genotype is available in Table S2 . Additional information available in Table S3 . Figure (A) was created with BioRender.com . |
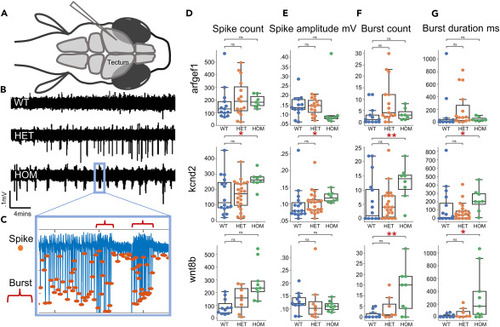
Epileptiform activity of larval tectum in electrophysiological recordings (A) Schematic representation of larval zebrafish LFP recordings. (B) Exemplary LFP recordings from kcnd2 larvae showing a dose sensitive increase in spike amplitude, frequency, distribution, and bursting. (C) Exemplary recordings of spike count, amplitude and burst count and duration. (D) Spike count quantification is increased kcnd2 and wnt8b HOM larvae compared to WT sibling controls. (E) Spike amplitude is increased in HOM kcnd2 larvae compared to WT sibling controls. (F and G) Burst count and duration increased in kcnd2 and wnt8b HOM compared to WT sibling controls. Arfgef1 WT: n = 12, HET: n = 15, HOM n = 7; kcnd2 WT: n = 16, HET: n = 23, HOM n = 8; wnt8b WT: n = 11, HET: n = 8, HOM n = 9. Statistical significance was determined by Kruskal-Wallis test with Dunn multiple comparisons, ∗p < 0.05, ∗∗p < 0.01, ∗∗∗p < 0.001. For D, E, F, and G, data are represented as median ±1.5∗IQR. Additional information available in Table S3 . |
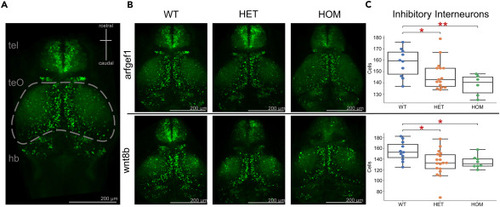
A dose-dependent decrease in the number of interneurons in a subset of zebrafish mutant lines, arfgerf1 and wnt8b (A) Schematic representation of larval zebrafish brain gross anatomy highlighting the optic tectum. (B) Exemplary images of arfgef1 and wnt8b mutant allele combinations. (C) Dose-dependent decrease in inhibitory interneurons in arfgef1 and wnt8b mutants compared to WT sibling controls. tel, telencephalon; teO, optic tectum; hb, hindbrain. Arfgef1 WT: n = 10, HET: n = 15, HOM n = 6; wnt8b WT: n = 11, HET: n = 18, HOM n = 8 Statistical significance was determined by Kruskal-Wallis test with Dunnett’s multiple comparisons, ∗p < 0.05, ∗∗p < 0.01, ∗∗∗p < 0.001. Data are represented as median ±1.5∗IQR. Scale bar is 200 μm. Additional information available in Table S3 . |
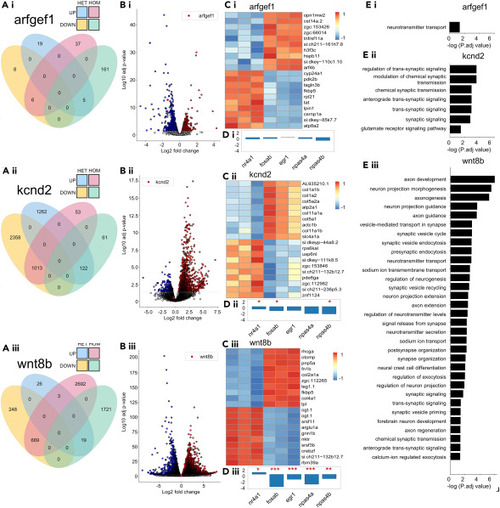
Mutants show dysregulation and coincidence, among phenotypically similar mutants, of epilepsy associated genes and ontologies (A.i–A.iii) Venn diagram of the total number differentially expressed genes (DEGs) per mutant genotype. (B.i–B.iii) Volcano plot of HOM vs. WT DEG’s per mutant genotype. (C.i–C.iii) The top twenty most up and down regulated genes in homozygous mutants versus control. (D.i–D.iii) HOM vs. WT mutants effect size estimation of differential immediate-early gene transcription. padj < 0.05, ∗p < 0.05, ∗∗p < 0.01, ∗∗∗p < 0.001. (E.i–E.iii) Selective and possibly explanatory GO terms from HOM vs. WT DEGs. Additional information available in Figure S1 . |