
|
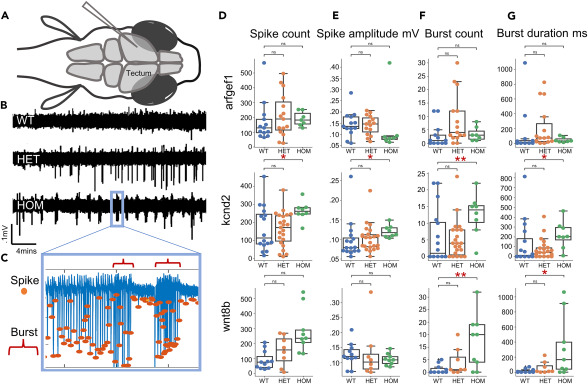
Fig. 2 Epileptiform activity of larval tectum in electrophysiological recordings (A) Schematic representation of larval zebrafish LFP recordings. (B) Exemplary LFP recordings from kcnd2 larvae showing a dose sensitive increase in spike amplitude, frequency, distribution, and bursting. (C) Exemplary recordings of spike count, amplitude and burst count and duration. (D) Spike count quantification is increased kcnd2 and wnt8b HOM larvae compared to WT sibling controls. (E) Spike amplitude is increased in HOM kcnd2 larvae compared to WT sibling controls. (F and G) Burst count and duration increased in kcnd2 and wnt8b HOM compared to WT sibling controls. Arfgef1 WT: n = 12, HET: n = 15, HOM n = 7; kcnd2 WT: n = 16, HET: n = 23, HOM n = 8; wnt8b WT: n = 11, HET: n = 8, HOM n = 9. Statistical significance was determined by Kruskal-Wallis test with Dunn multiple comparisons, ∗p < 0.05, ∗∗p < 0.01, ∗∗∗p < 0.001. For D, E, F, and G, data are represented as median ±1.5∗IQR. Additional information available in Table S3 .