
|
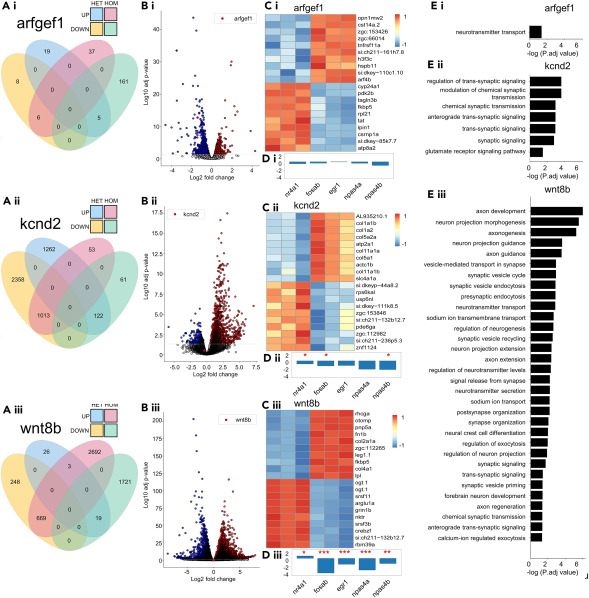
Fig. 4 Mutants show dysregulation and coincidence, among phenotypically similar mutants, of epilepsy associated genes and ontologies (A.i–A.iii) Venn diagram of the total number differentially expressed genes (DEGs) per mutant genotype. (B.i–B.iii) Volcano plot of HOM vs. WT DEG’s per mutant genotype. (C.i–C.iii) The top twenty most up and down regulated genes in homozygous mutants versus control. (D.i–D.iii) HOM vs. WT mutants effect size estimation of differential immediate-early gene transcription. padj < 0.05, ∗p < 0.05, ∗∗p < 0.01, ∗∗∗p < 0.001. (E.i–E.iii) Selective and possibly explanatory GO terms from HOM vs. WT DEGs. Additional information available in Figure S1 .