
- Title
-
RDH12 allows cone photoreceptors to regenerate opsin visual pigments from a chromophore precursor to escape competition with rods
- Authors
- Kaylor, J.J., Frederiksen, R., Bedrosian, C.K., Huang, M., Stennis-Weatherspoon, D., Huynh, T., Ngan, T., Mulamreddy, V., Sampath, A.P., Fain, G.L., Travis, G.H.
- Source
- Full text @ Curr. Biol.
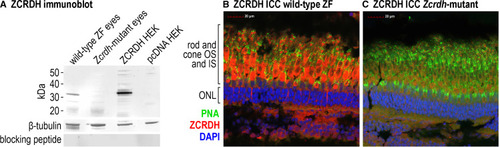
ZCRDH is expressed in zebrafish cone inner segments An antibody was generated against an N-terminal peptide ZCRDH (product of the zgc:153441 gene) ( Figure S2 ). (A) The antibody was tested with four different protein homogenates: pcDNA3.1 HEK, HEK293T cells transfected with the non-recombinant expression plasmid, pcDNA3.1; ZCRDH HEK, HEK293T cells transfected with plasmid containing the ZCRDH coding region; wild-type ZF eyes, whole-eye tissues from wild-type (AB strain) zebrafish; and Zcrdh-mutant eyes, whole-eye tissues from Zcrdh-mutant zebrafish. The antibody detected a protein band of the predicted size (∼37 kDa) in retinal homogenates from wild-type and ZCRDH-expressing HEK293T cells. The slightly higher molecular mass of ZCRDH in HEK-cell versus wild-type zebrafish retina homogenates is due to the presence of a FLAG epitope tag at the C terminus of recombinant ZCRDH. The same blot was re-probed with an antibody against β-tubulin as a protein loading control, shown below the ZCRDH immunoblot. A similar blot was probed with the ZCRDH antibody after preincubation with the immunizing peptide. Note the absence of signal in this control for Ab specificity. (B) Immunohistochemistry performed on adult wild-type zebrafish retinal sections using ZCRDH Ab (red), peanut agglutinin (PNA) lectin to label the sheath surrounding cone outer segments (green), and the nuclear stain 4′,6-diamidino-2-phenylindole DAPI (blue). Scale bar, 20 μm. ZCRDH immunoreactivity is strongly present in cone inner segments. (C) Immunocytochemistry performed on adult Zcrdh-mutant retinal sections using the same ZCRDH Ab, PNA, and DAPI labels as in (B). The region labeled “rod and cone IS and OS” corresponds to the region of rod and cone photoreceptor inner and outer segments, respectively. The region labeled “ONL” corresponds to the outer nuclear layer containing rod and cone photoreceptor nuclei. Scale bar, 20 μm. Note the greatly reduced labeling of cone inner segments in Zcrdh-mutant versus wild-type zebrafish retinas. See also Figure S2 . |
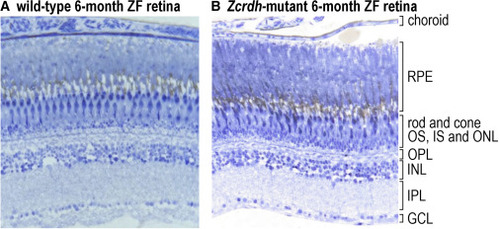
Histological analysis of retina sections from wild-type and Zcrdh-mutant zebrafish Histologic sections from 6-month-old wild-type (A) and Zcrdh-mutant (B) zebrafish retinas. Sections were stained with 1% toluidine blue and 1% sodium borate and photographed with a 20× objective. Retina layers are identified to the right of (B). RPE, retinal pigment epithelium; rod and cone OS, IS, and ONL, rod and cone outer segments, inner segments, and outer nuclear layer (containing rod and cone photoreceptor nuclei); OPL, outer plexiform layer; INL, inner nuclear layer; IPL, inner plexiform layer; GCL, ganglion cell layer. Note the similar number of photoreceptor nuclei and similar thickness of retinal layers in wild-type and Zcrdh-mutant retinas. |
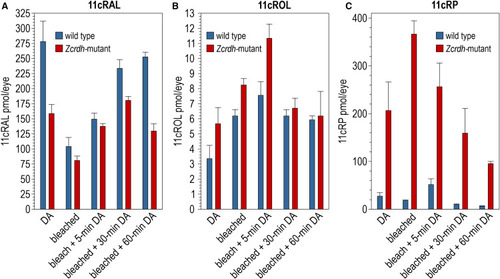
Retinoid profiles of Zcrdh-mutant and wild-type zebrafish eyes under different light-exposure conditions Whole-eye retinoid profiles of age-matched Zcrdh-mutant (red) and AB wild-type (blue) adult zebrafish (5 months old) under different light-exposure conditions: DA, overnight dark-adapted; bleached, immediately following an ∼50% photobleach; bleach + 5, 30, or 60 min DA, bleached followed by the indicated period of recovery in the dark. (A) 11cRAL chromophore levels in the eyes of wild-type or Zcrdh-mutant zebrafish after indicated light exposures. (B) 11cROL levels in the eyes of wild-type or Zcrdh-mutant zebrafish after indicated light exposures. (C) 11cRP levels in the eyes of wild-type or Zcrdh-mutant zebrafish after indicated light exposures. Error bars show standard deviation of the mean for four replicates (n = 4). |

Absent regeneration of cone visual pigments in Zcrdh-mutant retinal explants following a photobleach and treatment with 11cROL chromophore precursor Absorbance spectra of wild-type and Zcrdh-mutant zebrafish photoreceptors. (A) Average absorbance spectra from wild-type zebrafish M cones. The mean peak optical densities (± SEM) were ODDA = 0.024 ± 0.0025, ODbleach = 0.0036 ± 0.0033, and OD11cROL = 0.018 ± 0.0043. (B) Average absorbance spectra from wild-type zebrafish L cones. The mean peak optical densities were ODDA = 0.030 ± 0.0043, ODbleach = 0.0091 ± 0.0041, and OD11cROL = 0.021 ± 0.0039. (C) Average absorbance spectra from wild-type zebrafish rods. The mean peak optical densities were ODDA = 0.044 ± 0.0050, ODbleach = 0.0076 ± 0.0031, and OD11cROL = 0.0060 ± 0.0019. (D) Average absorbance spectra from Zcrdh-mutant zebrafish M cones. The mean peak optical densities were ODDA = 0.021 ± 0.0040, ODbleach = 0.0023 ± 0.0099, OD11cROL = 0.0059 ± 0.0038, and OD11cRAL = 0.017 ± 0.0028. (E) Average absorbance spectra from Zcrdh-mutant zebrafish L cones. The mean peak optical densities were ODDA = 0.018 ± 0.0037, ODbleach = 0.0033 ± 0.0070, OD11cROL = 0.0052 ± 0.0035, and OD11cRAL = 0.021 ± 0.0017. (F) Average absorbance spectra from Zcrdh-mutant zebrafish rods. The mean peak optical densities were ODDA = 0.029 ± 0.0028, ODbleach = 0.0020 ± 0.0028, OD11cROL = 0.0050 ± 0.0024, and OD11cRAL = 0.023 ± 0.0020. Data from dark-adapted and regenerated cells are fitted with A1 nomograms with the following parameters: WT DA M-cone, λmax = 492 nm, ODpeak = 0.025; WT 11cROL M-cone, λmax = 500 nm, ODpeak = 0.017; WT DA L-cone, λmax = 555 nm, ODpeak = 0.033; WT 11cROL L-cone, λmax = 547 nm, ODpeak = 0.024; WT DA rod, λmax = 498 nm, ODpeak = 0.047; Zcrdh-mutant DA M-cone, λmax = 502 nm, ODpeak = 0.018; Zcrdh-mutant 11cRAL M-cone, λmax = 491 nm, ODpeak = 0.021; Zcrdh-mutant DA L-cone, λmax = 554 nm, ODpeak = 0.022; Zcrdh-mutant 11cRAL L-cone, λmax = 551 nm, ODpeak = 0.023; Zcrdh-mutant DA rod, λmax = 507 nm, ODpeak = 0.027; Zcrdh-mutant 11cRAL rod, λmax = 510 nm, ODpeak = 0.022. |
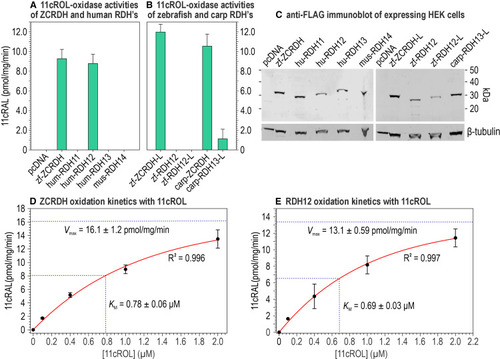
11cROL-oxidase activity of ZCRDH and various mammalian RDH candidates for the cone 11cROL-oxidase and substrate kinetics for ZCRDH and RDH12 HEK293T cells were transfected with non-recombinant pcDNA3.1 or the same plasmid containing the coding regions for the indicated proteins. All clones were made with a C-terminal FLAG tag. Assays were carried out using homogenate of the transfected cells as an enzyme source with 2 μM 11cROL and 1 mM NADP+ cofactor for 1 min at 37°C with gentle agitation. (A) 11cROL-oxidase activities (11cRAL synthesis): zf-ZCRDH, zebrafish ZCRDH; hum-RDH11, human RDH11; hum RDH12, human RDH12; hum-RDH13, human RDH13; and mus-RDH14, mouse RDH14. (B) 11cROL-oxidase activities: zf-ZCRDH-L, zebrafish ZCRDH-like; zf-RDH12, predicted zebrafish RDH12; zf-RDH12-L, predicted zebrafish RDH12-like; carp ZCRDH, carp ZCRDH; and carp RDH13-L, carp RDH13-like. (C) Immunoblots containing equal protein amounts of HEK293T cell homogenates transfected with the indicated plasmids and reacted with an anti-FLAG antibody. Note the similar intensities of immunoreactive bands containing the different proteins. The same blot was re-probed with an antibody against β-tubulin as a protein loading control, shown below the anti-FLAG immunoblot. (D and E) (D) Michaelis-Menton analysis of 11cROL oxidation of ZCRDH and (E) human RDH12 using the indicated 11cROL concentrations and 1 mM NADP+. The assay conditions for kinetic analysis are as described in this figure. Calculated KM and Vmax values are shown. Error bars show standard deviation of the mean for three replicates (n = 3). See also Figures S1 and S3 and Tables S1 and S2 . |

Comparison of redox-coupled catalytic activities of ZCRDH and human RDH12 (A) 11cRAL synthesis by ZCRDH and human RDH12 in enzyme assays containing 5 μM of the indicated substrate(s) and no added dinucleotide cofactor. (B) atROL synthesis by ZCRDH and human RDH12 containing 5 μM of the indicated substrate(s) and no added NADP(H) cofactor. Error bars at each concentration show standard deviation of the mean for three replicates (n = 3). Datasets were analyzed by one-way ANOVA followed by Student-Newman-Keuls t test to test for significance between different test groups. ∗p ≤ 0.05; ∗∗p ≤ 0.01; ∗∗∗p ≤ 0.001. Test group comparisons without indicated p values are not significant (p > 0.05). |

Proposed model for the photic cone visual cycle in Müller glial cells and cone photoreceptors Absorption of a photon (hv) by a cone-opsin pigment isomerizes the 11cRAL to atRAL, activating visual transduction. Shortly afterward, atRAL dissociates from the opsin, is reduced to atROL by RDH12, and is released into the extracellular space for recycling. The atROL is taken up by the Müller cell where it is re-oxidized by RDH10 to atRAL, which binds covalently to apo-RGR opsin. Absorption of a photon by RGR opsin isomerizes atRAL to 11cRAL. 30 The 11cRAL is reduced, again by RDH10, to 11cROL, which is released by Müller cells into the extracellular space. 15 Finally, the 11cROL is taken up by the cone photoreceptor where it is oxidized by RDH12 to 11cRAL, which combines with cone apo-opsin to form a new cone visual pigment. Because only cones can utilize 11cROL to regenerate their visual pigments, the visual cycle in Müller cells helps cones avoid competition with rods for chromophore under bright-light conditions. |