
- Title
-
Optogenetic β cell interrogation in vivo reveals a functional hierarchy directing the Ca2+ response to glucose supported by vitamin B6
- Authors
- Delgadillo-Silva, L.F., Tasöz, E., Singh, S.P., Chawla, P., Georgiadou, E., Gompf, A., Rutter, G.A., Ninov, N.
- Source
- Full text @ Sci Adv
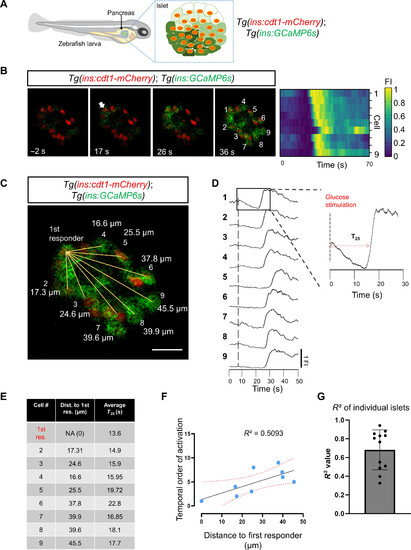
Calcium imaging in vivo reveals a proximity relationship between first-responder and follower cells. (A) Schematic representing a transgenic zebrafish expressing the genetically encoded calcium indicator GCaMP6 (green) and the nuclear marker cdt1-mCherry (red) in β cells. The insulin promoter expresses GCaMP6 in β cells, while cdt1-mCherry specifically labels the nuclei of β cells. (B) Snapshots from time-lapse recordings and raster plots of the primary islet at 6 Hz. The time stamp indicates the relative time to the glucose injection. The white arrow points to the β cell that responded first to the glucose stimulus. (C) The distance measured from the nuclei of the first-responder cell to the rest of the cells shown in (B). Scale bar, 10 μm. (D) Individual fluorescent traces from the cells shown in (B). (E) The table shows the distance (in μm) to the first-responder cell and the individual time of response (defined as a >25% increase in GCaMP6 fluorescence after glucose injection, T25). (F) Graph plotting the temporal order of activation of each cell versus the distance to the first responder from the islet shown in (B). The dotted line shows a linear regression and the associated R2 value. Each dot represents one cell. (G) The average R2 value was 0.609 with a ±SD of 0.27 (n = 12 independent samples). Data are shown as means ± SD. Cartoon of zebrafish larva in (A) reproduced with explicit permission from Nature Metabolism (www.nature.com/natmetab/) |
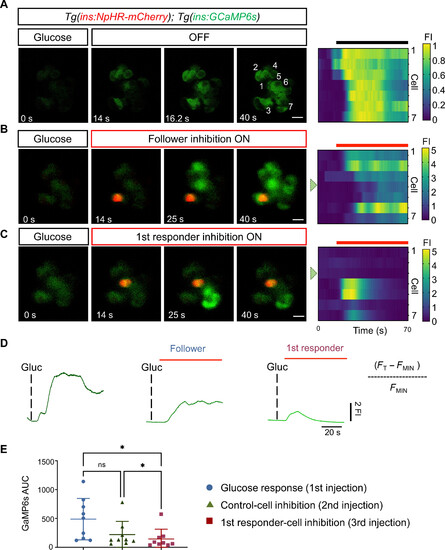
Optogenetic inhibition of first-responder cells using NpHR3.0 decreases the pan-islet glucose-stimulated calcium influx. (A) Images and raster plots from a time-lapse recording (6 Hz) of the islet after a glucose stimulation in Tg(ins:GCaMP6s); Tg(ins:eNpHR3.0-mCherry) double transgenic larvae. (B and C) Images from the islet shown in (A) after a glucose injection and simultaneous in vivo optogenetic inhibition with a green laser (λ = 561). The optogenetic inhibition was performed with the region of interest (ROI) scan encompassing the area of one follower or a first-responder β cell. Glucose was injected at 5-min intervals. The red signal corresponds to NpHR-mCherry fluorescence. (D) The traces show the normalized GCaMP6 fluorescence traces and the peak in calcium influx after glucose stimulation and upon the light-mediated inhibition of a control or a first-responder β cell. FI, fluorescence intensity. The red bars indicate the period of green laser exposure. (E) Quantification of the area under the curve (AUC) reflecting 250 frames (37.5 s) of normalized GCaMP6 fluorescence after glucose injection, follower-cell inhibition, and first-responder cell inhibition (n = 9 independent samples) [one-way paired analysis of variance (ANOVA), Tukey’s correction. *P = 0.0226 “glucose response versus first-responder cell” and *P = 0.0259 “control cell versus first-responder cell”; ns, not significant). Data are shown as means ± SD. Scale bars, 10 μm. |

Optogenetic activation using CheRiff reveals the presence of a functional hierarchy of β cells. (A) Cartoon representing the rationale for optogenetic interrogation of individual β cells. (B to D) Images and raster plots from calcium recoding and simultaneous in vivo optogenetic activation with a blue laser (λ = 470). The time-lapse recording was performed at 6 Hz in Tg(ins:K-GECO1);Tg(ins:CheRiff-GFP) double transgenics. The green signal corresponds to CheRiff-GFP fluorescence. The optogenetic activation was performed with an ROI scan encompassing the area of one cell. The traces (E) show the cumulative normalized K-GECO1 fluorescence for the cells outside the area of laser illumination. The blue bars indicate the period of blue-laser exposure. White arrowheads point to the illuminated cells. Scale bars, 10 μm. (F) The table shows the number of β cells co-activated by illuminating individual β cells shown in B. (G) Chart showing the functional hierarchy of β cells (n = 49 cells from 10 independent samples). Only ~14% of β cells can propagate the calcium across >75% of the cells in the imaging plane. Data are shown as mean ± SD. Scale bars, 10 μm. |
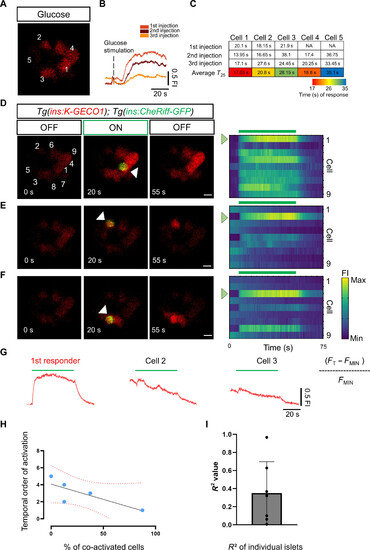
Combining CheRiff activation with glucose stimulation shows that first responders occupy the top of the functional hierarchy. (A) Image from a time-lapse recording at 6 Hz of the islet after a glucose injection. The traces (B) show the cumulative normalized K-GECO1 fluorescence traces after glucose stimulation. Glucose was injected at 5-min intervals. (C) The table shows the time of response for individual cells (K-GECO1 fluorescence increase to >25% above baseline). The cells are numbered according to their position in (A). The table shows a color key of the relative time of response for individual cells to each glucose injection. (D to F) Representative images and raster plots from the time-lapse recordings show the optogenetic activation of cells from the islet in (A). The optogenetic activation was performed via an ROI scan encompassing the area of one cell. The white arrowhead points to the illuminated β cell. (G) The traces show the cumulative normalized K-GECO1 fluorescence traces for β cells outside of the area of illumination. The blue bar indicates the period of blue laser exposure. (H) Graph plotting the percentage of co-activated β cells versus the time of response for each cell. The dotted line shows a linear regression and the associated R2 value. Each dot represents one cell. (I) The average R2 value from seven samples was 0.316 with a ±SD of 0.265 (n = 39 cells from seven independent samples). Data are shown as means ± SD. Scale bars, 10 μm |
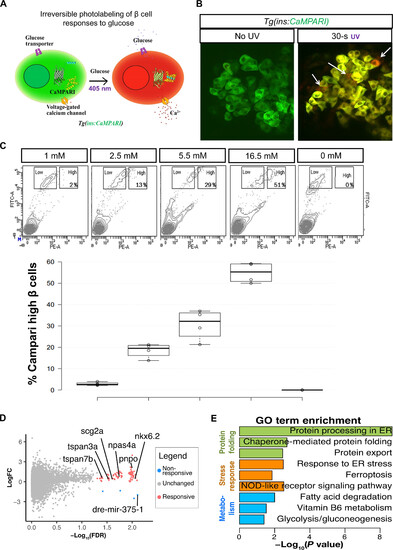
Transcriptional profile of highly glucose-responsive β cells. (A) Schematic of CaMPARI-based labeling of glucose sensitive β cells. The Tg(ins:CaMPARI) line expresses CaMPARI specifically in the zebrafish β cells. Cells that respond to glucose stimulation have an influx of calcium ions. An increase in intracellular calcium, along with exposure to ultraviolet (UV) light irreversibly converts the fluorescence of CaMPARI from green to red. (B) Ex vivo labeling of glucose responsiveness. Confocal image of the primary islets from 30-dpf (days postfertilization) Tg(ins:CaMPARI) animals incubated in 2.5 mM glucose and not exposed to UV (left) or with 30 s of UV exposure (right). UV exposure induces green-to-red photoconversion (arrows). (C) Representative fluorescence-activated cell sorting (FACS) profiles (top) and quantification (bottom) of Tg(ins:CaMPARI) islets exposed to varying amounts of glucose and UV ex vivo. The x axis represents red fluorescence [phycoerythrin (PE)], while the y axis represents green fluorescence [fluorescein isothiocyanate (FITC)]. Square boxes outline the cells with a low red-to-green ratio (nonresponsive) and with a high red-to-green ratio (responsive). The percentage in the high box represents the proportion of responsive β cells. The quantification represents the percentage of responsive β cells as a boxplot (n = 4 independent samples per condition). (D) Volcano plot representing differentially expressed [false discovery rate (FDR) < 0.05] between β cells responsive at 2.5 mM and β cells unresponsive at 16.5 mM. Genes enriched in responsive cells are labeled in pink, while genes enriched in nonresponsive cells are labeled in blue. LogFC, log fold change. (E) Gene ontology (GO) analysis for differentially expressed genes. Data shown as means ± SD. ER, endoplasmic reticulum. NOD, nonobese diabetic. |
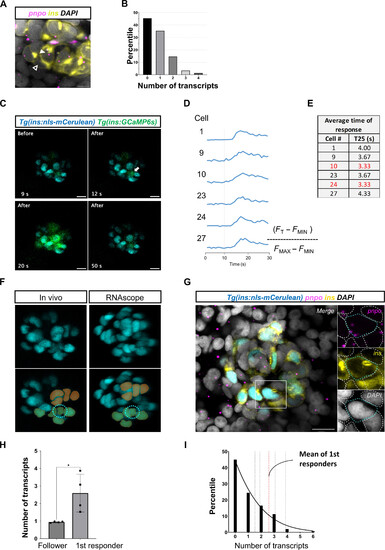
pnpo marks first-responder β cells. (A) RNAscope analysis of pnpo expression in β cells in the islets of zebrafish larvae (5 dpf). (B) Individual β cells show a heterogeneous number of pnpo transcripts. Most cells have zero transcripts. A small proportion (5%) of the cells have three and four transcripts (n = 5 independent samples). β Cells are shown in yellow using insulin immunofluorescence and pnpo transcripts are in magenta. The white arrowhead points to a pnpo-positive β cell with two pnpo transcripts. The dark arrowhead points to a pnpo-negative β cells. (C) Representative Ca2+ responses to glucose injection. The images represent maximum projections of confocal slices spanning the whole islet. (D) Fluorescent traces from individual selected cells. (E) Speed of response of selected cells from the time-lapse imaging. (F) The β cells from the in vivo imaging were matched with maps of pnpo transcripts following RNAscope analysis of pnpo expression. A nuclear fluorescent reporter (blue) was used as for cell matching of β cells and recognizable landmarks (pseudocolors) were used to match the cells. (G) The expression of pnpo is shown for the first-responder cell identified using the time-lapse shown in (C). β Cells are shown in yellow using insulin immunofluorescence, and pnpo transcripts are in magenta. (H) Comparison of average number of transcripts between first-responder and follower cells (n = 4 independent samples). (I) Percentile distribution of β cells according to number of pnpo transcripts (n = 4 independent samples). The mean transcript number for first-responder β cells is indicated with a red line. Unpaired two-tailed t tests; *P = 0.0286. Data are shown as means ± SEM. Scale bars, 10 μm. |

pnpo and vitamin B6 are necessary for the β cell Ca2+ response to glucose in zebrafish. (A to C) Time lapse of β cell Ca2+ activity upon triple-glucose stimulation of Tg(ins:GCaMP6s);Tg(ins:cdt1-mCherry) larvae treated with dimethyl sulfoxide (DMSO), 1 mM 4-deoxypyridoxine (4-DP), or 200 μM ginkgotoxin (GT). The panels show frames with high β cell activity following each stimulus (single focal-plane imaging at 1 Hz for 120 s). Glucose injection was performed at the 10th second of each recording. The time stamp shows time relative to the start of recording. (D to F) Normalized GCaMP fluorescence traces. Red lines indicate glucose injection. (G) AUC of normalized GCaMP fluorescence after glucose injection for DMSO, 4-DP, and GT. Each dot represents the average of three glucose stimulations per sample (n = at least four independent samples per group). One-way ANOVA with Dunnett’s correction. **P = 0.0090 for DMSO versus 4-DP; **P = 0.0084 for DMSO versus GT. (H) Maximum GCaMP fluorescence (Fmax) recorded throughout the imaging for DMSO, 4-DP, and GT (n = at least four independent samples per group). One-way ANOVA with Dunnett’s correction. *P = 0.0235 for DMSO versus 4-DP; *P = 0.0210 for DMSO versus GT. (I and J) Time lapse of β cell Ca2+ activity in pnpo+/+ and pnpo−/− larvae (5 dpf). Imaging parameters as in (A). (K and L) Normalized fluorescence traces. Red lines indicate glucose injection. (M) AUC of normalized GCaMP fluorescence for pnpo+/+ and pnpo−/−. Each dot represents the average of three glucose stimulations per sample (n = at least eight independent samples per group). Unpaired two-tailed t test, *P = 0.0388. (N) Maximum GCaMP fluorescence (Fmax) recorded throughout the imaging for pnpo+/+ and pnpo−/−. Unpaired two-tailed t test, *P = 0.0248. Each dot represents the average of three stimulations (n = at least eight independent samples per group). Data are shown as means ± SEM. |
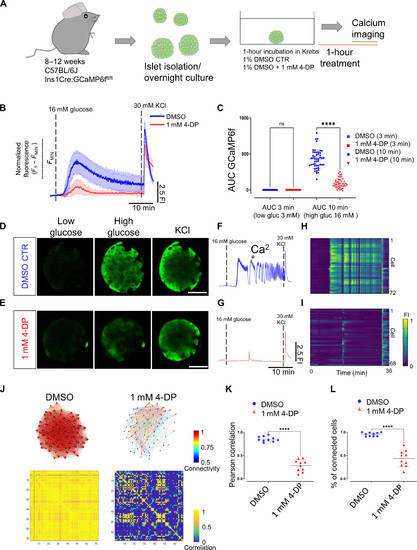
Vitamin B6 antagonism reduces the Ca2+ response and the β cell coordination in mouse islets. (A) Experimental design for in vitro calcium imaging of islets from male C57BL/6J Ins1Cre:GCaMP6ffl/fl mice aged 10 weeks with 4-DP treatment. (B) Average calcium fluorescent traces from control and 1 mM 4-DP–treated islets. The blue and red lines show average GCaMP6f fluorescent traces and SDs from the imaged islets. (C) AUC quantifications from controls and 1 mM 4-DP–treated islets at 3 and 10 min. Each dot represents an islet (one-way paired ANOVA, Tukey’s correction ****P = 1.60 × 10−73; 48 islets for 1% DMSO controls and 42 islets for 1 mM 4-DP, from three mice). (D and E) Snapshots from a time-lapse recording of the individual islet at 0.5 Hz before and after glucose stimulation and KCl depolarization from control and 1 mM 4-DP treatment. (F and G) Normalized GCaMP6f fluorescence traces upon glucose stimulation (16 mM glucose) and 30 mM KCl depolarization from control and 1 mM 4-DP–treated islet shown in (D) and (E). (H and I) Raster plots show the GCaMP6f signal for individual cells from islets shown in (D) and (E). (J) Connectivity map and Pearson correlation matrix of the islets in (D) and (E) during the first-phase response. (K) Pearson correlation of individual islets (unpaired two-tailed Student’s t test. ****P = 3.87 × 10⁻⁸) during the first-phase response. (L) Percentage of connected cells of individual islets during the first-phase response. n = 10 islets from three mice (1% DMSO) and n = 10 islets from three mice (1 mM 4-DP) (unpaired two-tailed Student’s t test. ****P = 9.47 × 10⁻¹¹). Data are shown as means ± SD. Scale bars, 40 μm. |
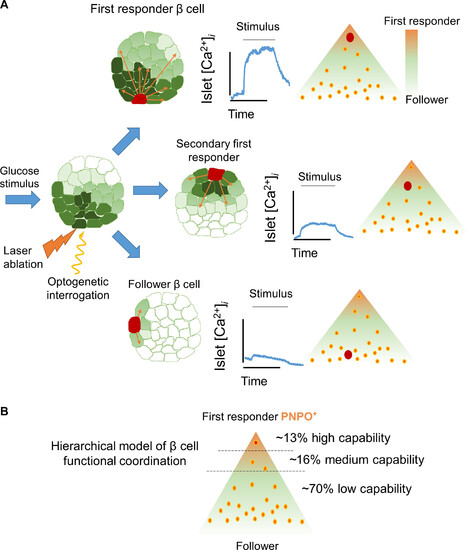
Model of coordination based on β cell hierarchies. (A) The functional characterization of islet coordination via optogenetics leads us to propose a hierarchical model for β cell coordination. The coordination involves first-responder cells at the top of the hierarchy, as well as follower cells at the bottom. (B) First-responder β cells are characterized by higher expression of the vitamin B6 production enzyme pnpo. The first-responder β cells are capable of triggering a Ca2+ response across many cells. Some β cells present medium to low capability to co-activate other β cells. The rest of the β cells are followers because they present a low capability to recruit β cells. The co-activation capability of the cells and their proportions were determined on the basis of the pooled data from the CheRiff optogenetic analysis. |