
Fig. 3
- ID
- ZDB-IMAGE-240627-78
- Publication
- Delgadillo-Silva et al., 2024 - Optogenetic β cell interrogation in vivo reveals a functional hierarchy directing the Ca2+ response to glucose supported by vitamin B6
- All Figures
- Figures for Delgadillo-Silva et al., 2024
|
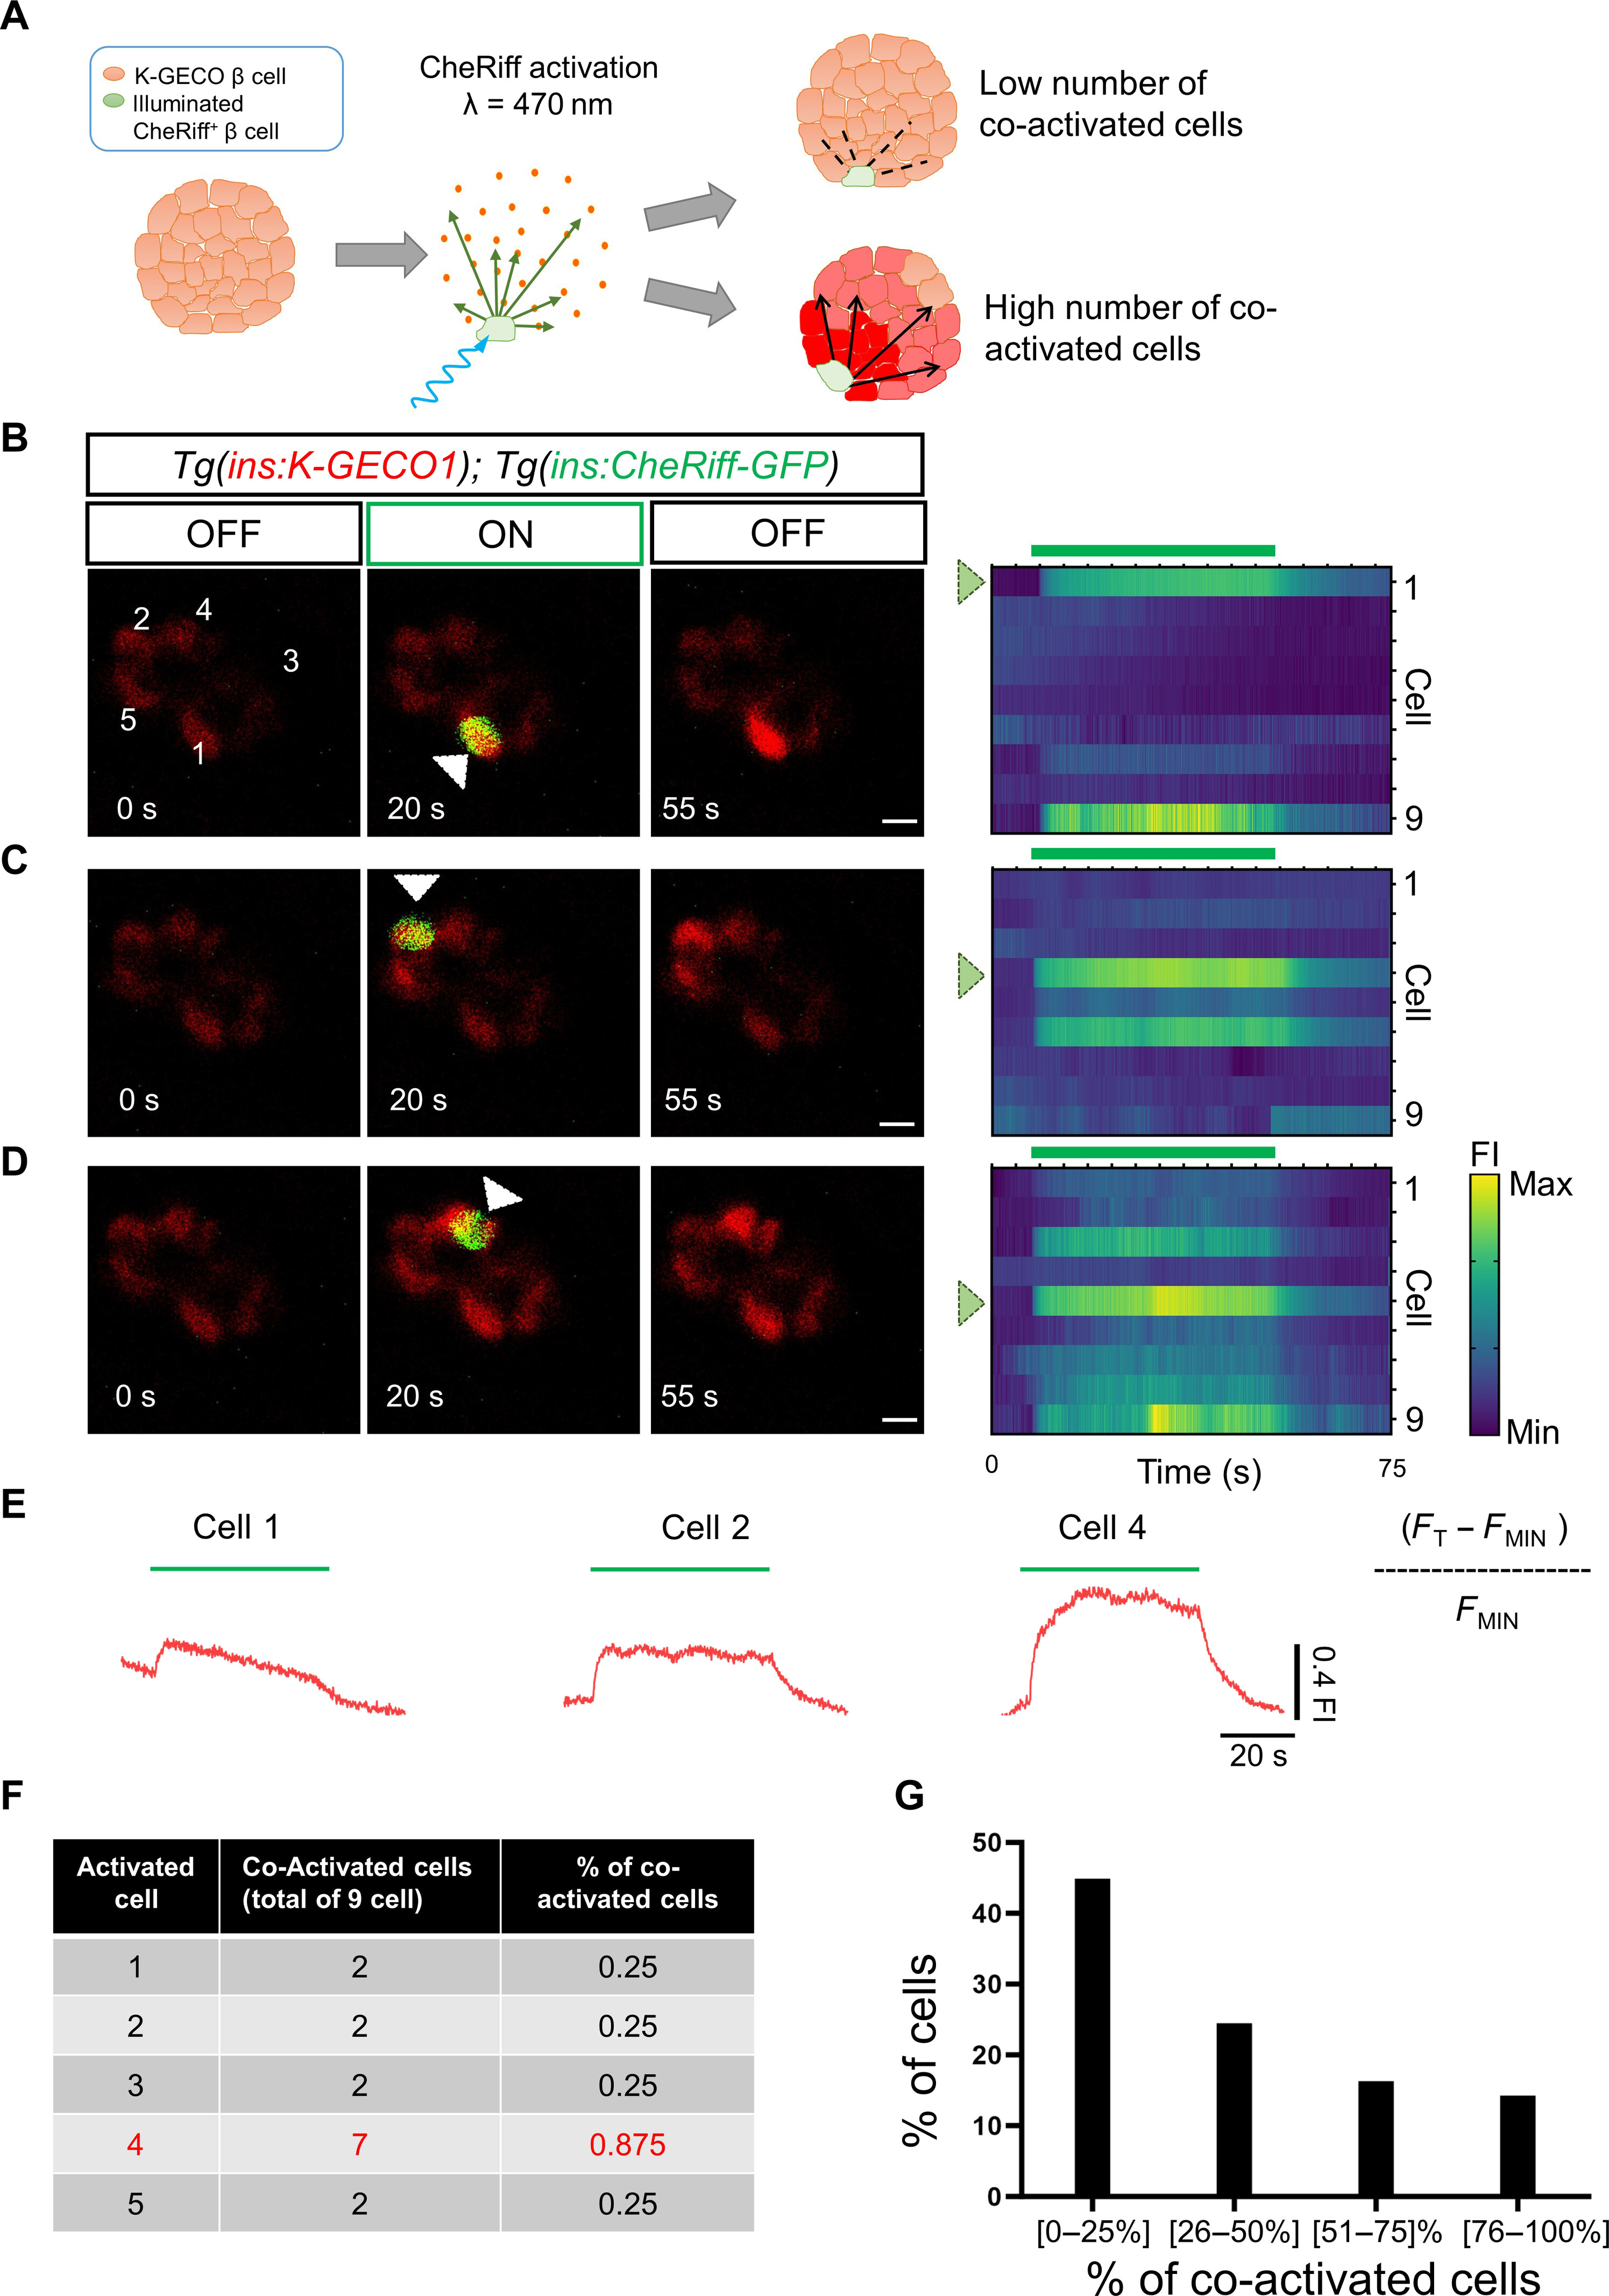
Fig. 3 Optogenetic activation using CheRiff reveals the presence of a functional hierarchy of β cells. (A) Cartoon representing the rationale for optogenetic interrogation of individual β cells. (B to D) Images and raster plots from calcium recoding and simultaneous in vivo optogenetic activation with a blue laser (λ = 470). The time-lapse recording was performed at 6 Hz in Tg(ins:K-GECO1);Tg(ins:CheRiff-GFP) double transgenics. The green signal corresponds to CheRiff-GFP fluorescence. The optogenetic activation was performed with an ROI scan encompassing the area of one cell. The traces (E) show the cumulative normalized K-GECO1 fluorescence for the cells outside the area of laser illumination. The blue bars indicate the period of blue-laser exposure. White arrowheads point to the illuminated cells. Scale bars, 10 μm. (F) The table shows the number of β cells co-activated by illuminating individual β cells shown in B. (G) Chart showing the functional hierarchy of β cells (n = 49 cells from 10 independent samples). Only ~14% of β cells can propagate the calcium across >75% of the cells in the imaging plane. Data are shown as mean ± SD. Scale bars, 10 μm.