
Fig. 5
- ID
- ZDB-FIG-240627-80
- Publication
- Delgadillo-Silva et al., 2024 - Optogenetic β cell interrogation in vivo reveals a functional hierarchy directing the Ca2+ response to glucose supported by vitamin B6
- Other Figures
- All Figure Page
- Back to All Figure Page
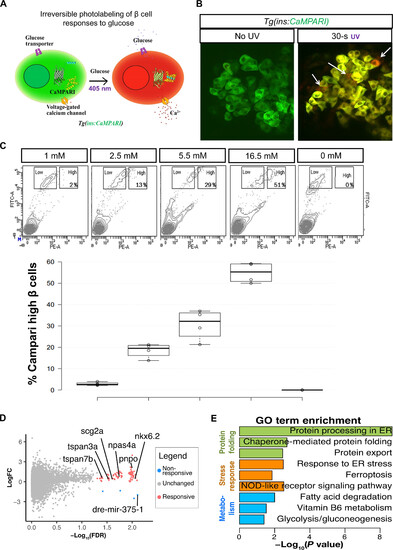
Transcriptional profile of highly glucose-responsive β cells. (A) Schematic of CaMPARI-based labeling of glucose sensitive β cells. The Tg(ins:CaMPARI) line expresses CaMPARI specifically in the zebrafish β cells. Cells that respond to glucose stimulation have an influx of calcium ions. An increase in intracellular calcium, along with exposure to ultraviolet (UV) light irreversibly converts the fluorescence of CaMPARI from green to red. (B) Ex vivo labeling of glucose responsiveness. Confocal image of the primary islets from 30-dpf (days postfertilization) Tg(ins:CaMPARI) animals incubated in 2.5 mM glucose and not exposed to UV (left) or with 30 s of UV exposure (right). UV exposure induces green-to-red photoconversion (arrows). (C) Representative fluorescence-activated cell sorting (FACS) profiles (top) and quantification (bottom) of Tg(ins:CaMPARI) islets exposed to varying amounts of glucose and UV ex vivo. The x axis represents red fluorescence [phycoerythrin (PE)], while the y axis represents green fluorescence [fluorescein isothiocyanate (FITC)]. Square boxes outline the cells with a low red-to-green ratio (nonresponsive) and with a high red-to-green ratio (responsive). The percentage in the high box represents the proportion of responsive β cells. The quantification represents the percentage of responsive β cells as a boxplot (n = 4 independent samples per condition). (D) Volcano plot representing differentially expressed [false discovery rate (FDR) < 0.05] between β cells responsive at 2.5 mM and β cells unresponsive at 16.5 mM. Genes enriched in responsive cells are labeled in pink, while genes enriched in nonresponsive cells are labeled in blue. LogFC, log fold change. (E) Gene ontology (GO) analysis for differentially expressed genes. Data shown as means ± SD. ER, endoplasmic reticulum. NOD, nonobese diabetic. |