FIGURE SUMMARY
Title

Suppression of Contraction Raises Calcium Ion Levels in the Heart of Zebrafish Larvae

Authors
Martinez-Sielva, A., Vicente, M., Salgado-Almario, J., Garcia-Blazquez, A., Domingo, B., Llopis, J.
Source
Full text @ Biosensors (Basel)

Morphological and functional alterations in 3 dpf tnnt2a morphant larvae in Tg(myl7:Twitch-4) zebrafish. (A) Pericardial edema (arrow) was observed in tnnt2a morphants compared to their siblings. (B) Fractional area change (FAC, see Section 2) measured in the ventricle shows that the tnnt2a morpholino completely abolishes heart contraction. (C) Tnnt2a morphant larvae had a ventricular area in between that of sibling larvae in systole and diastole (n = 36 sibling, n = 37 MO tnnt2a). (D) Yolk area of siblings (n = 31), larvae injected with control MO (n = 33), and those injected with MO tnnt2a (n = 17). (E) Morphology of atrium and ventricle of representative sibling, control morphant, and tnnt2a morphant larvae. The number of larvae presenting a particular phenotype in tnnt2a MO larvae is shown. (F) Percentage of sibling, control morphant, and tnnt2a morphant larvae displaying AV blocks at 3 and 5 dpf. (G) Atrial and ventricular Ca2+ traces of a representative 3 dpf Tg(myl7:mCyRFP1-GCaMP6f) larva showing atrioventricular conduction blocks (i.e., a drop in ventricular CaT). Statistical analysis in C was performed using a one-way ANOVA test with Tukey’s multiple comparisons post-test. Statistical analysis in E was performed using a χ2 test. Data are shown as the mean ± SD ** for p < 0.01, *** for p < 0.001 and **** p < 0.0001 for parametric statistics; x for p < 0.05 and xxxx for p < 0.0001 for non-parametric statistics). The scale bars in (A,D) indicate 300 µm and 100 µm, respectively.

Increased Ca2+ levels, Ca2+ transient amplitude, and bradycardia in 3 dpf larvae injected with tnnt2a MO. (A) Ratiometric images of hearts in pseudocolor and their corresponding atrial (red) and ventricular (black) Ca2+ traces from representative 3 dpf Tg(myl7:Twitch-4) sibling and morphant larvae. Images from siblings and MO controls show the ventricular mechanical systole. The calibration square shows the distance in µm (horizontal length), whereas the hue codes for the emission ratio, and intensity codes for the fluorescence intensity. (B) Atrial and ventricular systolic Ca2+ (Twitch-4 emission ratio), diastolic Ca2+, and Ca2+ transient amplitude in sibling (n = 29), water-injected (n = 39), control morphant (n = 29), and tnnt2a morphant (n = 41) larvae. (C) Atrial CaT frequency (min−1) in these larvae. (D) Time-averaged Ca2+ levels (L/Lmax) measured by bioluminescence of 3 dpf Tg(myl7:GFP-aequorin) sibling (n = 6), control morphant (n = 6), and tnnt2a morphant (n = 8) larvae. Diacetyl h-coelenterazine was used as the aequorin substrate. Statistical analysis was performed using a one-way ANOVA test with Tukey’s multiple comparisons post-test or Kruskal–Wallis with Dunn’s multiple comparisons post-test, for parametric or non-parametric statistics, respectively. In (B,C), the mean of MO-tnnt2a morphants was compared with the mean of the other groups. Data are shown as the mean ± SD (* for p < 0.05 and **** p < 0.0001 for parametric statistics; xxxx for p < 0.0001 for non-parametric statistics).

Increased Ca2+ levels, Ca2+ transient amplitude, and bradycardia in 3 dpf Tg(myl7:mCyRFP1-GCaMP6f) larvae injected with tnnt2a MO. (A) Ratiometric images of hearts and atrial and ventricular Ca2+ traces from representative 3 dpf Tg(myl7: mCyRFP1-GCaMP6f) sibling and tnnt2a morphant larvae. The image of siblings shows the mechanical systole of the ventricle. (B) Atrial and ventricular systolic Ca2+ (mCyRFP1-GCaMP6f emission ratio), diastolic Ca2+, and Ca2+ transient amplitude in sibling (n = 23) and tnnt2a morphant (n = 28) larvae. (C) Atrial CaT frequency (min−1) in these larvae. Statistical analysis was performed using an unpaired Student’s t-test and the Mann–Whitney test for non-parametric data. Data are shown as the mean ± SD (** for p < 0.01 and **** p < 0.0001 for parametric statistics; xx for p < 0.01, xxxp < 0.001, and xxxx p < 0.0001 for non-parametric statistics).

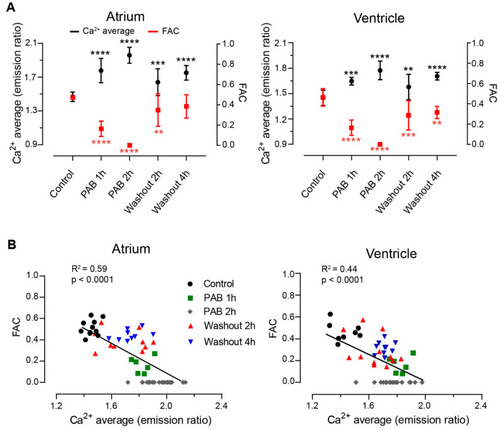
Suppression of heart contraction with para-aminoblebbistatin raises Ca2+ levels, Ca2+ transient amplitude, and induces bradycardia in 3 dpf larvae. (A) Ratiometric images of hearts and atrial and ventricular Ca2+ traces from representative 3 dpf Tg(myl7:Twitch-4) untreated larvae and larvae preincubated with para-aminoblebbistatin (PAB, 75 µM) for 2 h. Image of the untreated larva shows the mechanical systole of the ventricle. (B) Atrial and ventricular systolic Ca2+ (Twitch-4 emission ratio), diastolic Ca2+, and Ca2+ transient amplitude in untreated larvae (n = 15), and in larvae preincubated with PAB (n = 15). (C) Atrial CaT frequency (min−1) in these larvae. (D) Time-averaged Ca2+ levels (L/Lmax) measured by bioluminescence of 3 dpf Tg(myl7:GFP-aequorin) untreated larvae (n = 5), and in larvae preincubated with 75 µM PAB for 2 h (n = 10). Diacetyl h-coelenterazine was used as the aequorin substrate. Statistical analysis was performed using an unpaired Student’s t-test for parametric data and the Mann–Whitney test for non-parametric data. Data are shown as the mean ± SD (* for p < 0.05, ** p < 0.01, *** p < 0.001, and **** p < 0.0001 for parametric statistics, and xxxx p < 0.0001 for non-parametric statistics).

Incubation and washout of para-aminoblebbistatin in 3 dpf Tg(myl7:Twitch-4) zebrafish larvae. (A) Atrial and ventricular average Ca2+ levels (Twitch-4 emission ratio) and fractional area change (FAC) in control larvae (n = 18), in larvae during incubation with 75 µM para-aminoblebbistatin (PAB 1 h, n = 8, and PAB 2 h, n = 22), and in larvae during washout after 2 h of PAB treatment (washout 2 h, n = 20, and washout 4 h, n = 20). Statistical analysis was performed using a one-way ANOVA test with Dunnett’s multiple comparisons post-test. Data are shown as the mean ± SD (** p < 0.01, *** p < 0.001, **** p < 0.0001). (B) Inverse correlation between heart contraction and Ca2+ levels (Twitch-4 emission ratio) of individual larvae before (control), after incubation with 75 µM PAB (1 or 2 h), and after washout of PAB (2 or 4 h). A linear regression test was performed, and the coefficient of correlation (R2) was calculated.

Acknowledgments
This image is the copyrighted work of the attributed author or publisher, and ZFIN has permission only to display this image to its users. Additional permissions should be obtained from the applicable author or publisher of the image. Full text @ Biosensors (Basel)