IMAGE

Figure 1

ID
ZDB-IMAGE-240527-3
Source
Figures for Martinez-Sielva et al., 2024
Image
Figure Caption

Figure 1

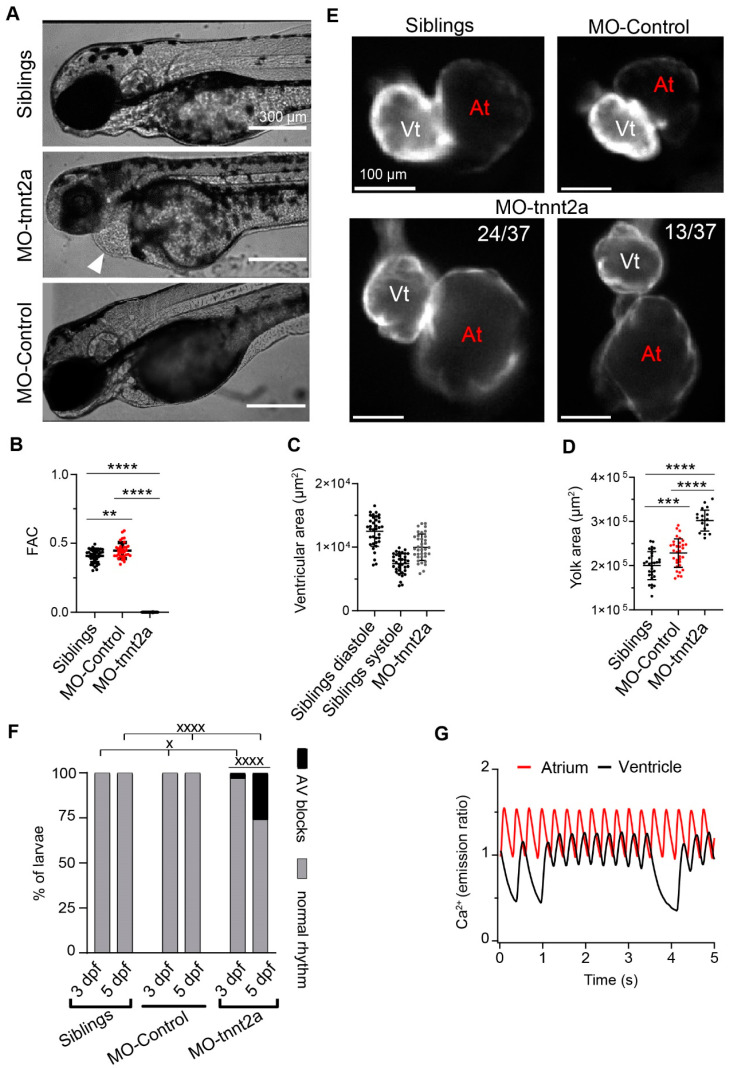
Morphological and functional alterations in 3 dpf tnnt2a morphant larvae in Tg(myl7:Twitch-4) zebrafish. (A) Pericardial edema (arrow) was observed in tnnt2a morphants compared to their siblings. (B) Fractional area change (FAC, see Section 2) measured in the ventricle shows that the tnnt2a morpholino completely abolishes heart contraction. (C) Tnnt2a morphant larvae had a ventricular area in between that of sibling larvae in systole and diastole (n = 36 sibling, n = 37 MO tnnt2a). (D) Yolk area of siblings (n = 31), larvae injected with control MO (n = 33), and those injected with MO tnnt2a (n = 17). (E) Morphology of atrium and ventricle of representative sibling, control morphant, and tnnt2a morphant larvae. The number of larvae presenting a particular phenotype in tnnt2a MO larvae is shown. (F) Percentage of sibling, control morphant, and tnnt2a morphant larvae displaying AV blocks at 3 and 5 dpf. (G) Atrial and ventricular Ca2+ traces of a representative 3 dpf Tg(myl7:mCyRFP1-GCaMP6f) larva showing atrioventricular conduction blocks (i.e., a drop in ventricular CaT). Statistical analysis in C was performed using a one-way ANOVA test with Tukey’s multiple comparisons post-test. Statistical analysis in E was performed using a χ2 test. Data are shown as the mean ± SD ** for p < 0.01, *** for p < 0.001 and **** p < 0.0001 for parametric statistics; x for p < 0.05 and xxxx for p < 0.0001 for non-parametric statistics). The scale bars in (A,D) indicate 300 µm and 100 µm, respectively.

Acknowledgments
This image is the copyrighted work of the attributed author or publisher, and ZFIN has permission only to display this image to its users. Additional permissions should be obtained from the applicable author or publisher of the image. Full text @ Biosensors (Basel)