
- Title
-
β-Sitosterol Reduces the Content of Triglyceride and Cholesterol in a High-Fat Diet-Induced Non-Alcoholic Fatty Liver Disease Zebrafish (Danio rerio) Model
- Authors
- Zhang, P., Liu, N., Xue, M., Zhang, M., Xiao, Z., Xu, C., Fan, Y., Qiu, J., Zhang, Q., Zhou, Y.
- Source
- Full text @ Animals (Basel)

β-sitosterol reduces the content of triglyceride and cholesterol in zebrafish. ( |
β-sitosterol reduces the content of triglyceride and cholesterol in zebrafish. ( |

Changes in microvessels in the zebrafish vitreous vascular system. ( |

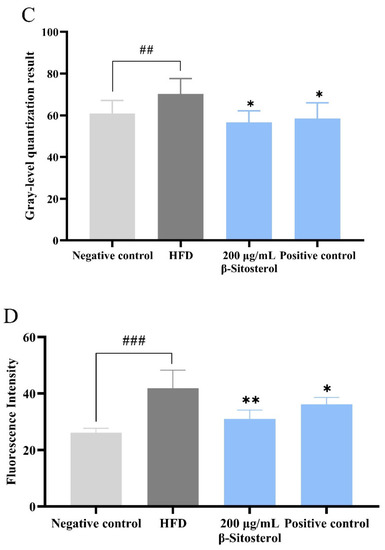
β-Sitosterol reduces the contents of triglyceride and cholesterol in the liver of zebrafish. ( |
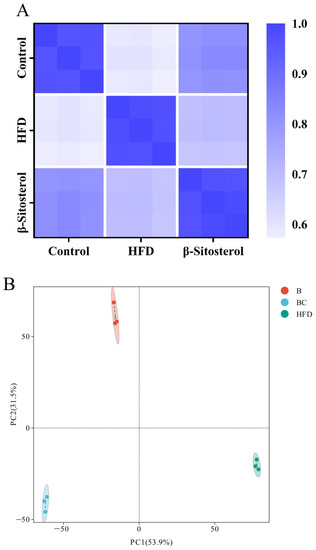
Lipid metabolome analysis of adult zebrafish liver. ( |
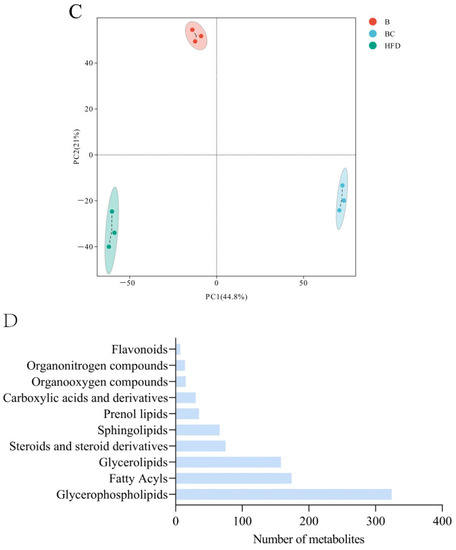
Lipid metabolome analysis of adult zebrafish liver. ( |
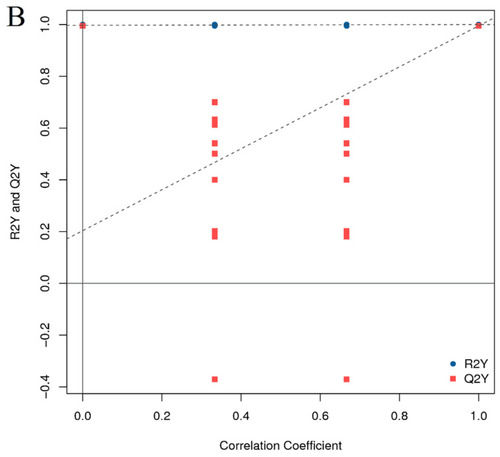
Orthogonal projections to latent structures discriminant analysis (OPLS-DA). ( |
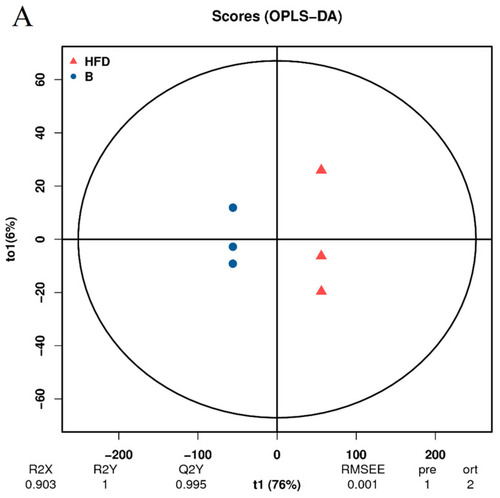
Orthogonal projections to latent structures discriminant analysis (OPLS-DA). ( |

Analysis of differentially expressed lipid metabolites (DELMs) between HFD and β-sitosterol groups. ( |
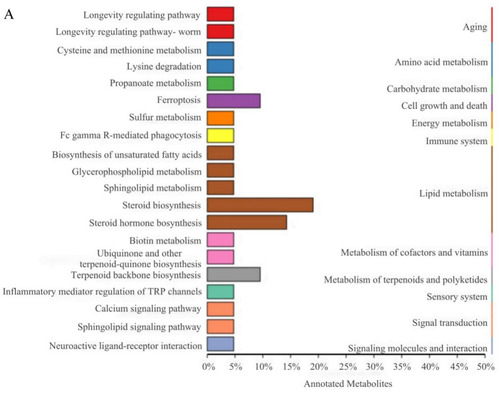
Differential lipid KEGG functional annotation and enrichment analysis results. ( |
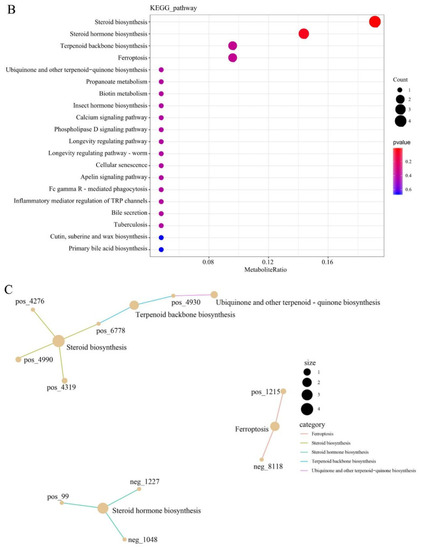
Differential lipid KEGG functional annotation and enrichment analysis results. ( |
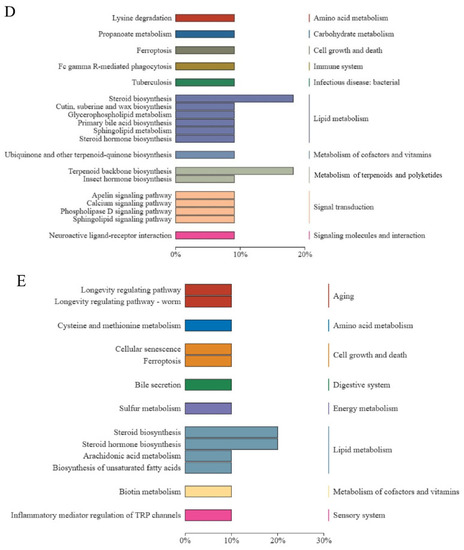
Differential lipid KEGG functional annotation and enrichment analysis results. ( |

Effects of β-sitosterol on the expression of |