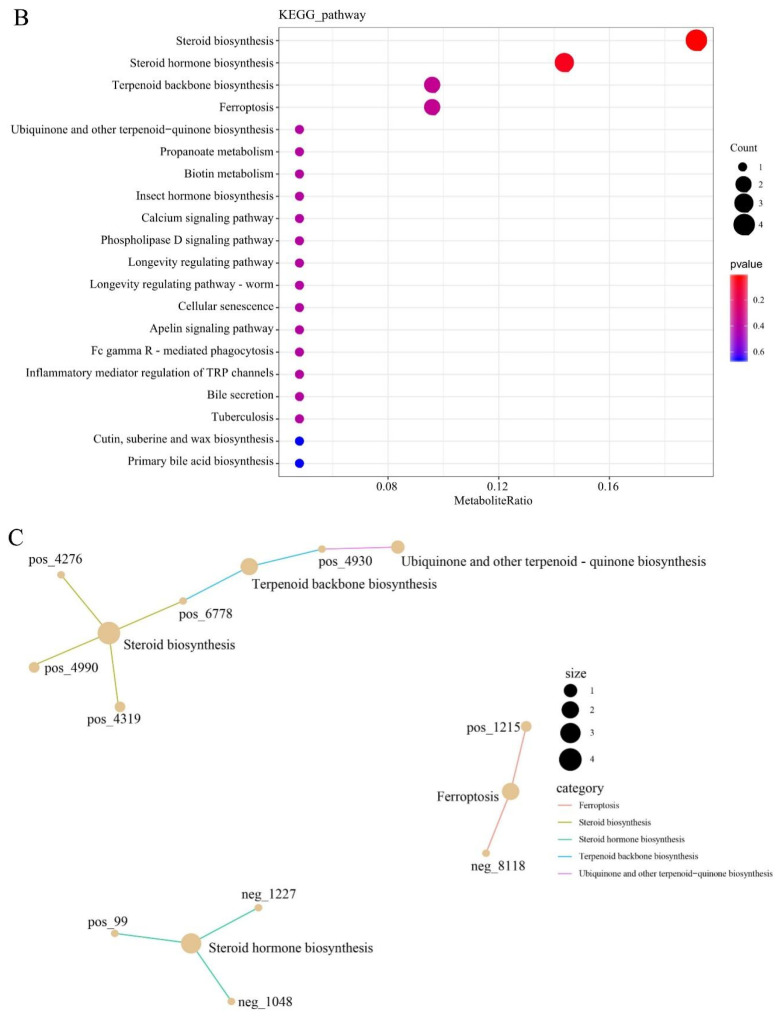
Differential lipid KEGG functional annotation and enrichment analysis results. (A) The annotation results of the TOP20 differential lipid KEGG enrichment. The entries shown in the same box indicate the hierarchical classification annotation of the KEGG pathway, and the column length shows the number of lipids annotated to each pathway. (B) Differential lipid KEGG annotation results for the TOP20 enrichment point map. (C) Differential lipid KEGG annotation results from TOP20 enrichment network map. (D) KEGG functional annotation and enrichment analysis results of the upregulated metabolites in differential lipids. (E) KEGG functional annotation and enrichment analysis results of the downregulated metabolites in differential lipids.
Acknowledgments
This image is the copyrighted work of the attributed author or publisher, and
ZFIN has permission only to display this image to its users.
Additional permissions should be obtained from the applicable author or publisher of the image.
Full text @ Animals (Basel)
Your Input Welcome
Thank you for submitting comments. Your input has been emailed to ZFIN curators who may contact you if
additional information is required.
Oops. Something went wrong. Please try again later.