
- Title
-
A Functional Schizophrenia-associated genetic variant near the TSNARE1 and ADGRB1 genes
- Authors
- Wahbeh, M.H., Boyd, R.J., Yovo, C., Rike, B., McCallion, A.S., Avramopoulos, D.
- Source
- Full text @ HGG Adv
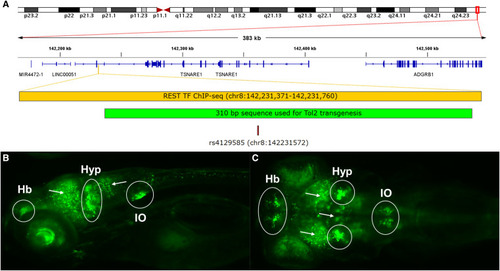
Reporter expression patterns driven by sequences around rs4129585 (A) A modified IGV (Integrative Genomics Viewer) and SnapGene track showing the relative position (hg38 coordinates) of a noncoding REST/NRSF TF binding sequence containing rs4129585 within intron 12 of TSNARE1. This sequence drives reporter expression in F2 zebrafish embryos t 6 d.p.f. (B and C) Dorsal (B) and lateral (C) views of a representative zebrafish embryo with GFP expression patterns in the habenula (Hb), hypothalamus (Hyp), and inferior olive (IO), as well as glutamatergic neurotransmitters (arrows). |
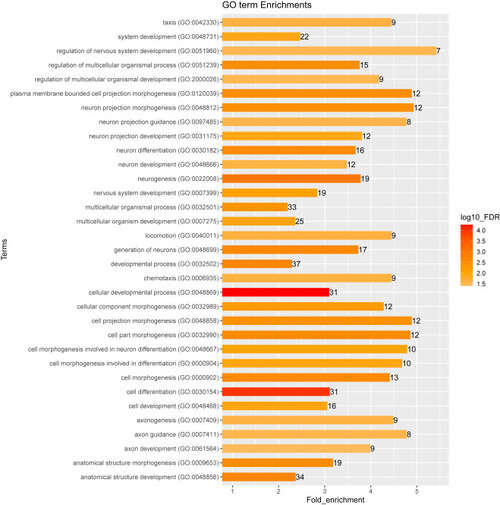
GO terms for functional enrichments among DE genes reported by PANTHER Bar color indicates level of statistical significance (log10_FDR), numbers indicate the number of genes enriched in the pathway, and bar length indicates the fold enrichment of the genes observed in our uploaded list over the expected representation of genes in each Gene Ontology (GO) category. |
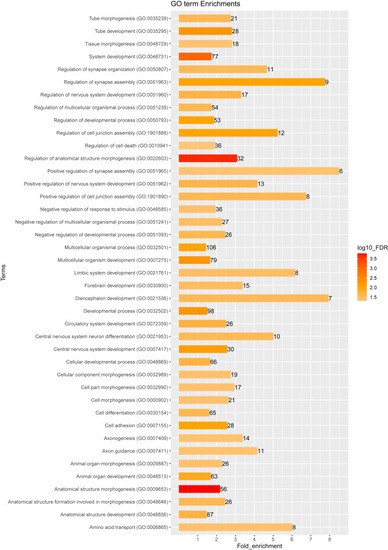
GO terms for functional enrichment within the STRING network of interacting proteins identified from our DR genes Bar color indicates level of statistical significance, numbers indicate the number of genes enriched in the network, and bar length indicates the fold enrichment of the genes observed in our uploaded list over the expected representation of genes in each Gene Ontology (GO) category. |
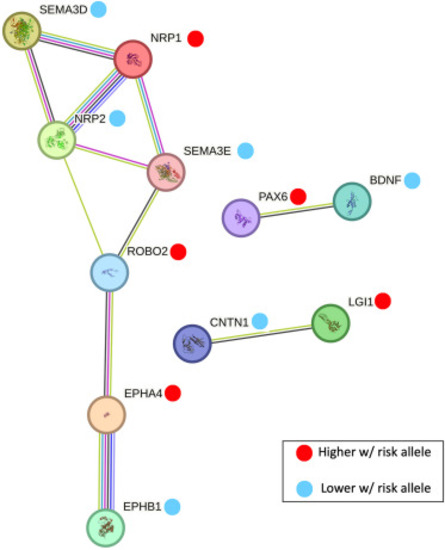
The 11 axon guidance genes in the STRING network of DE genes Blue dots indicate proteins in the network whose genes are downregulated in the NPCs containing the risk allele, and red dots indicate proteins in the network whose genes are upregulated in the NPCs containing the risk allele. Image generated by the STRING website. |