
Image
|
Figure Caption
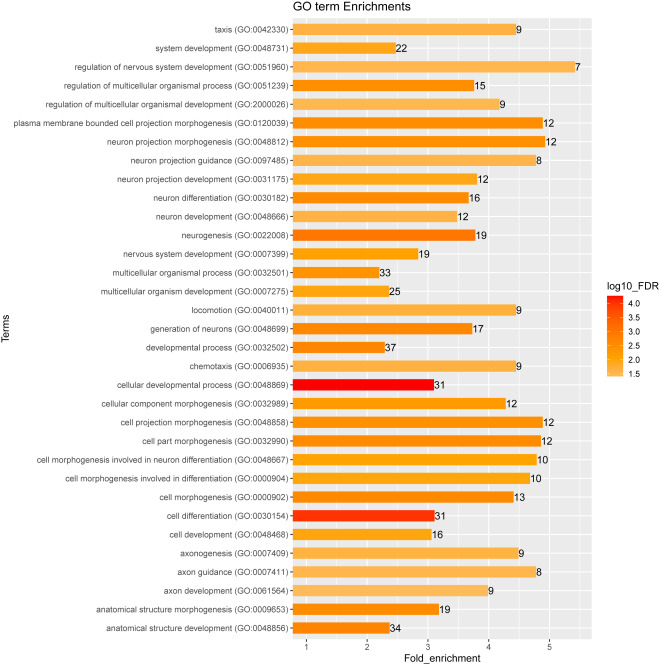
Fig. 2 GO terms for functional enrichments among DE genes reported by PANTHER Bar color indicates level of statistical significance (log10_FDR), numbers indicate the number of genes enriched in the pathway, and bar length indicates the fold enrichment of the genes observed in our uploaded list over the expected representation of genes in each Gene Ontology (GO) category.
Acknowledgments
This image is the copyrighted work of the attributed author or publisher, and
ZFIN has permission only to display this image to its users.
Additional permissions should be obtained from the applicable author or publisher of the image.
Full text @ HGG Adv