
Image
|
Figure Caption
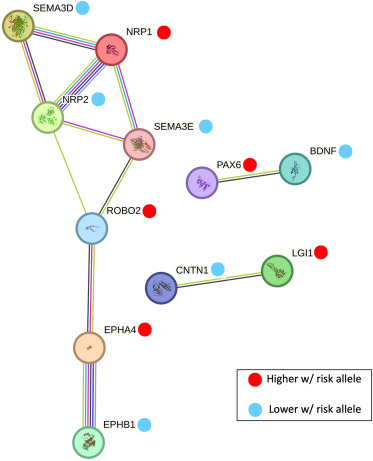
Fig. 4 The 11 axon guidance genes in the STRING network of DE genes Blue dots indicate proteins in the network whose genes are downregulated in the NPCs containing the risk allele, and red dots indicate proteins in the network whose genes are upregulated in the NPCs containing the risk allele. Image generated by the STRING website.
Acknowledgments
This image is the copyrighted work of the attributed author or publisher, and
ZFIN has permission only to display this image to its users.
Additional permissions should be obtained from the applicable author or publisher of the image.
Full text @ HGG Adv