FIGURE SUMMARY
Title

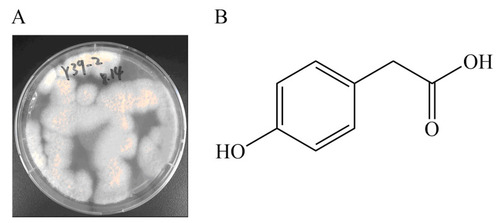
Marine-Fungus-Derived Natural Compound 4-Hydroxyphenylacetic Acid Induces Autophagy to Exert Antithrombotic Effects in Zebrafish

Authors
Xin, S., Zhang, M., Li, P., Wang, L., Zhang, X., Zhang, S., Mu, Z., Lin, H., Li, X., Liu, K.
Source
Full text @ Mar. Drugs

(A) The marine-derived fungus Emericellopsis maritima Y39–2. (B) Structure of the HPA.

Observation of 72 hpf zebrafish larvae exposed to HPA for 6 h. (A) Mortality curve and (B) mortality rate at 6 hpe. The data are presented as the means ± SEMs; **** p < 0.0001 and * p < 0.05 compared to the control group.

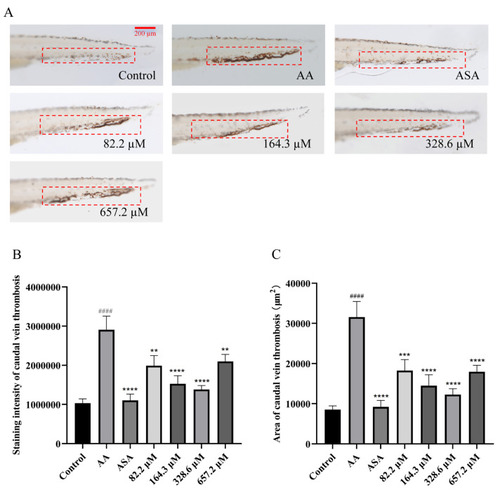
Reduction of caudal thrombus in zebrafish treated with HPA. (A) Typical images of caudal thrombus staining in zebrafish. Quantitative analysis of (B) the intensity and (C) the area of caudal thrombus staining. The data are presented as the means ± SEMs; ####p < 0.0001 compared to the control group; **** p < 0.0001, *** p < 0.001, and ** p < 0.01 compared to the AA group.

Increase in cardiac erythrocytes in zebrafish treated with HPA. (A) Typical images of erythrocyte staining in zebrafish heart (shaded areas are indicated by arrows). Quantitative analysis of (B) the area and (C) the intensity of cardiac erythrocyte staining. The data are presented as the means ± SEMs; ####p < 0.0001 compared to the control group; **** p < 0.0001 and *** p < 0.001 compared to the AA group.

Reduction in the AA-induced inflammatory response in zebrafish treated with HPA. (A) Typical images of inflammatory cell migration in zebrafish from all groups. (B) Quantitative evaluation of the quantity of migrating inflammatory cells. The data are presented as the means ± SEMs; ####p < 0.0001 compared to the control group; **** p < 0.0001 and *** p < 0.001 compared to the AA group.

Improvement in caudal blood flow velocity and heart rate in zebrafish treated with HPA. (A) Blood flow dynamics of the caudal vein in zebrafish. Quantitative analysis of (B) the caudal blood flow velocity and (C) the heart rate in one minute. The data are presented as the means ± SEMs; ####p < 0.0001 compared to the control group; **** p < 0.0001 and ** p < 0.01 compared to the AA group.

Differentially expressed genes (DEGs) in zebrafish. (A,B) Volcano plots for DEGs of AA vs. control and HPA vs. AA. (C) Venn plot for the DEGs of AA vs. control and HPA vs. AA. (D) Venn plot of the DEGs downregulated in the HPA group vs. the AA group and upregulated in the AA group vs. the control group. (E) Venn plot of the DEGs upregulated in the HPA group vs. the AA group and downregulated in the AA group vs. the control group.

GO enrichment analysis results of 191 DEGs obtained from screening. BP in red: biological processes, CC in green: cellular composition, MF in blue: molecular function.

KEGG enrichment analysis results of 191 DEGs obtained from screening.

The results of qRT–PCR analysis. Quantitative analysis of the mRNA expression levels of genes associated with (A) the PI3K/AKT/mTOR signaling pathway and (B) the autophagy signaling pathway. The data are presented as the means ± SEMs; #### p < 0.0001, ### p < 0.001, ## p < 0.01, and # p < 0.05 compared to the control group; **** p < 0.0001, *** p < 0.001, ** p < 0.01, and * p < 0.05 compared to the AA group.

Acknowledgments
This image is the copyrighted work of the attributed author or publisher, and ZFIN has permission only to display this image to its users. Additional permissions should be obtained from the applicable author or publisher of the image. Full text @ Mar. Drugs