FIGURE SUMMARY
Title

Screening of Microalgae for Bioactivity with Antiviral, Antibacterial, Anti-Inflammatory and Anti-Cancer Assays

Authors
Hernández-Urcera, J., Romero, A., Cruz, P., Vasconcelos, V., Figueras, A., Novoa, B., Rodríguez, F.
Source
Full text @ Biology (Basel)

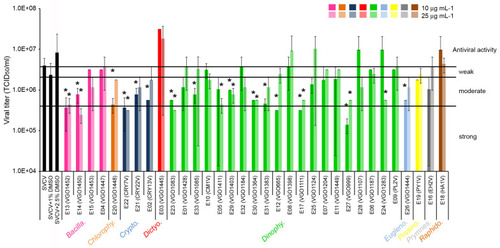
Antiviral activity of the extracts against SVCV. The different algal groups selected are indicated. The viral titer was determined at day 6 post-infection as the viral dilution that causes an infection of 50% of the cell line (TCID50). Results were expressed as the mean and SD of four titrations. A T-test was used to determine significant differences at p-value < 0.05 (*) between control (SVCV infected cells) and cells treated with the extracts at day 6 post-infection. Using the calculated percentage of inhibition (PI), the antiviral activity was scored as strong (PI > 90%), moderate (PI between 50 and 90%) and weak (PI < 50%) according to Monteiro et al. [57].

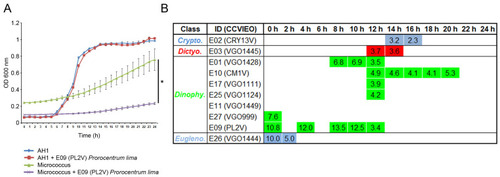
The antibacterial activity of extracts (10 μg mL−1) against Gram (−) bacteria. The different algal groups selected are indicated. The bacterial growth was evaluated by measuring the OD600 nm for 24 h; (A) The kinetics obtained in samples treated with the extract 9 was selected as representative result. T-test was used to determine significant differences at p-value < 0.05 (*). (B) Tables show the sampling points where the differences in OD600 nm were statistically significant at p < 0.05 against A. hydrophyla. The percentage of bacterial growth reduction is specified in each sampling point.

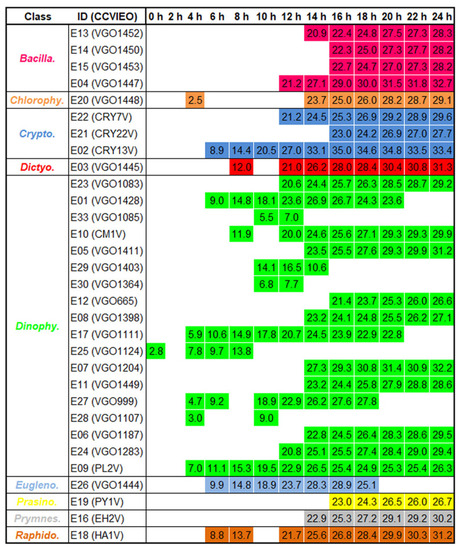
The antibacterial activity of extracts (10 μg mL−1) against Gram (+) bacteria. Table shows the sampling points where the differences in OD600 nm were statistically significant at p < 0.05 against M. luteus. The percentage of bacterial growth reduction is specified in each sampling point. T-test was used to determine significant differences at p-value < 0.05.

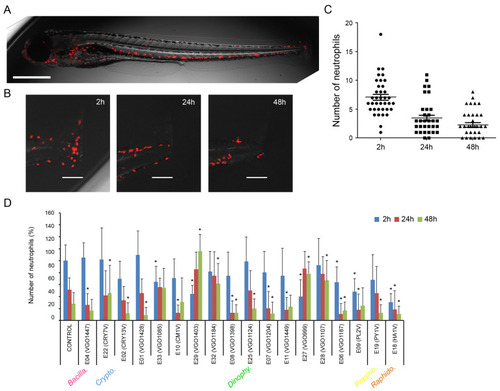
In vivo evaluation of the anti-inflammatory activity of the extracts (at 25 μg mL−1) using zebrafish larvae. The different algal groups selected are indicated. (A) The transgenic zebrafish larvae Tg(lyz:DsRed2) was used. The lysozyme-expressing cells (neutrophils) are marked in red and can be analyzed in live animals. Scale bar = 500 µm; (B) Control animals were injured in the tail and the number of neutrophils was measured at 2 h, 24 h and 48 h. Scale bar = 100 µm; (C) Evolution in the number of neutrophils at the injury in control fish. The graph was created using information obtained from 50 animals. (D) Effect of the extracts on the number of neutrophils at the injured fin. Results represent the mean and SD. (*) asterisks represent significant differences (p < 0.05) compared to controls.

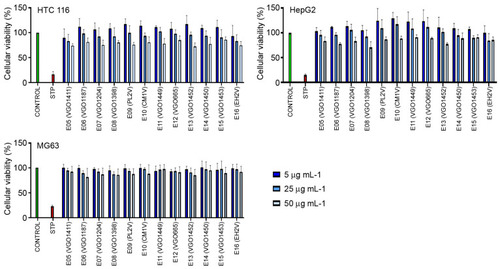
Anti-cancer activity of the extracts against HCT 116, HepG2 and MG-63. Results represent the mean and SD of three independent experiments. STP (staurosporine).

Acknowledgments
This image is the copyrighted work of the attributed author or publisher, and ZFIN has permission only to display this image to its users. Additional permissions should be obtained from the applicable author or publisher of the image. Full text @ Biology (Basel)