
Image
|
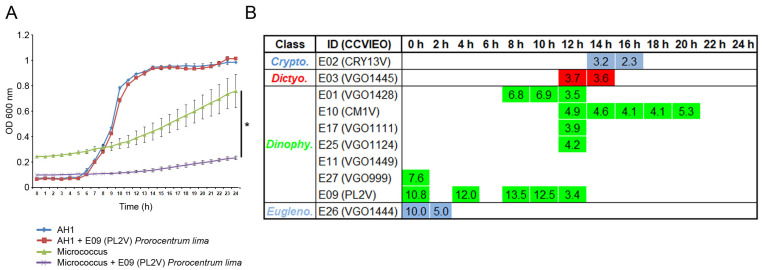
Figure Caption
Figure 2
The antibacterial activity of extracts (10 μg mL−1) against Gram (−) bacteria. The different algal groups selected are indicated. The bacterial growth was evaluated by measuring the OD600 nm for 24 h; (
Acknowledgments
This image is the copyrighted work of the attributed author or publisher, and
ZFIN has permission only to display this image to its users.
Additional permissions should be obtained from the applicable author or publisher of the image.
Full text @ Biology (Basel)