IMAGE

Figure 4

ID
ZDB-IMAGE-240429-155
Source
Figures for Hernández-Urcera et al., 2024
Image
Figure Caption

Figure 4

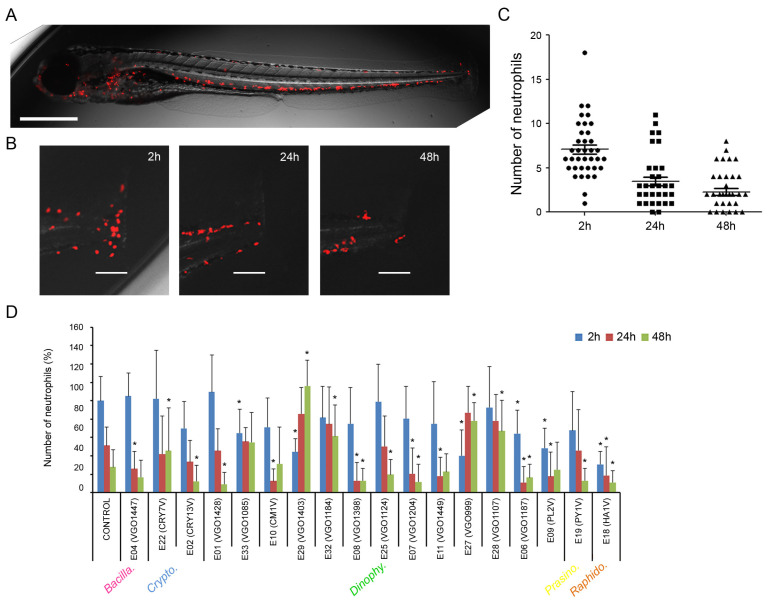
In vivo evaluation of the anti-inflammatory activity of the extracts (at 25 μg mL−1) using zebrafish larvae. The different algal groups selected are indicated. (A) The transgenic zebrafish larvae Tg(lyz:DsRed2) was used. The lysozyme-expressing cells (neutrophils) are marked in red and can be analyzed in live animals. Scale bar = 500 µm; (B) Control animals were injured in the tail and the number of neutrophils was measured at 2 h, 24 h and 48 h. Scale bar = 100 µm; (C) Evolution in the number of neutrophils at the injury in control fish. The graph was created using information obtained from 50 animals. (D) Effect of the extracts on the number of neutrophils at the injured fin. Results represent the mean and SD. (*) asterisks represent significant differences (p < 0.05) compared to controls.

Acknowledgments
This image is the copyrighted work of the attributed author or publisher, and ZFIN has permission only to display this image to its users. Additional permissions should be obtained from the applicable author or publisher of the image. Full text @ Biology (Basel)