Amino acid sequence and structure of Crotoxin B (PLA2) from Crotalus durissus terrificus snake venom. (A) Amino acid sequence of Crotoxin B. The regions that originated the peptides 1, 2, and 3 are shown within the blue, orange, and red boxes, respectively. The residues from the catalytic site are highlighted in yellow, while the residues from the Ca2+ binding site are highlighted in green. The residues highlighted in purple are important for Crotoxin B toxicity/lethality, myotoxicity, edema induction, antibacterial, liposome-disrupting, enzymatic, and anticoagulant activities. (B) Structure of Crotoxin B (PDB: 2QOG) with the regions that originated peptides 1 and 2 highlighted with carbon atoms in green and peptide 3 highlighted with carbon atoms in purple.
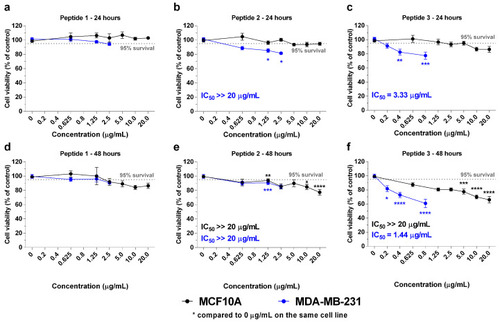
Evaluation of Crotoxin B-derived peptides on cellular viability against TNBC cells and mammary benign cells. MDA-MB-231 (blue line) and MCF10A cells (black line) were treated with peptides 1 (a,d), 2 (b,e), and 3 (c,f) for 24 and 48 h at the concentration range of 0.2–20 µg/mL. Cellular viability assay was evaluated using the MTT method. Data are shown as mean ± SEM of at least three independent assays. Significant differences between control (0 µg/mL) and treated cells are designated as * p < 0.05, ** p < 0.01, *** p < 0.001, and **** p < 0.0001, according to two-way ANOVA and a Bonferroni post hoc test.
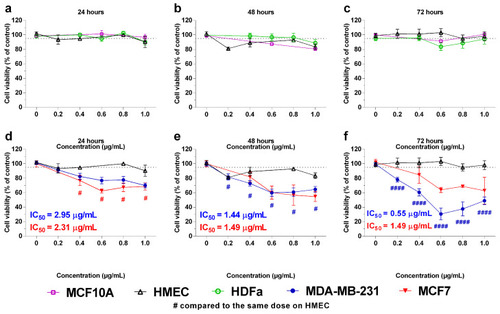
Activity of 3-NAntC (peptide 3) in breast cancer cell lines compared to benign cells. Tumor (MDA-MB-231 and MCF-7) and benign (HDFa, HMEC, and MCF10A) cell lines were treated with 3-NAntC for 24, 48, and 72 h at the concentration range of 0.2–1.0 µg/mL. Cellular viability assay was conducted using the MTT method. Data are shown as mean ± SEM of at least three independent assays in triplicate. (a–c) Benign cell lines treated with the same concentrations of 3-NAntC were compared to the control (0 µg/mL) using two-way ANOVA and a Bonferroni post hoc test. (d–f) MDA-MB-231 and MCF-7 tumor cell lines were treated with various concentrations of 3-NAntC and compared to the HMEC benign cell line using two-way ANOVA and a Bonferroni post hoc test, # p < 0.05, and #### p < 0.0001.
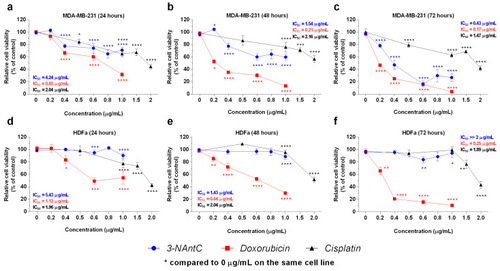
Comparison of cell viability between 3-NAntC and chemotherapy (doxorubicin and cisplatin). Cellular viability assays were performed on MDA-MB-231 (a–c) and HDFa (d–f) cell lines using the MTT method. Cells were treated with 3-NAntC, cisplatin, or doxorubicin for 24, 48, and 72 h at concentrations ranging from 0.2 to 2.0 µg/mL. Data are presented as mean ± SEM of at least three independent assays in triplicate. Significant differences between the control (0 µg/mL) and treated cells are designated as * p < 0.05, ** p < 0.01, *** p < 0.001, and **** p < 0.0001, according to two-way ANOVA and a Bonferroni post hoc test.
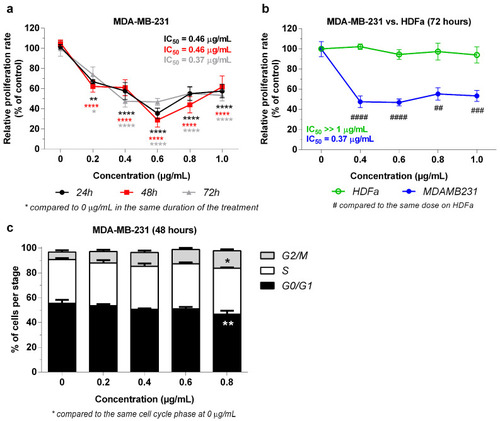
Antiproliferative effects of 3-NAntC in TNBC and normal cells. (a,b) Cellular proliferation assay using the BrdU incorporation method. MDA-MB-231 and HDFa cells were treated with 3-NAntC for 24, 48, and 72 h at a concentration range of 0.2–1.0 µg/mL. Data are shown as a mean ± SEM of at least three independent assays in triplicate. * p < 0.05, ** p < 0.01, and **** p < 0.0001 show significance compared to the control (0 µg/mL), and ## p < 0.01, ### p < 0.001, and #### p < 0.0001 show significance compared to the same concentration in HDFa cell lines according to the two-way ANOVA and a Bonferroni post hoc test. (c) Cell cycle progression assay. Cells were treated with 3-NAntC for 48 h at the concentration range of 0.2–0.8 µg/mL. A flow cytometry assay was conducted with propidium iodide labeling. Data are shown as a mean ± SEM of at least three independent assays. Significant differences between the control (0 µg/mL) and treated cells are designated as * p < 0.05, and ** p < 0.01, according to the two-way ANOVA and Dunnett post hoc test.
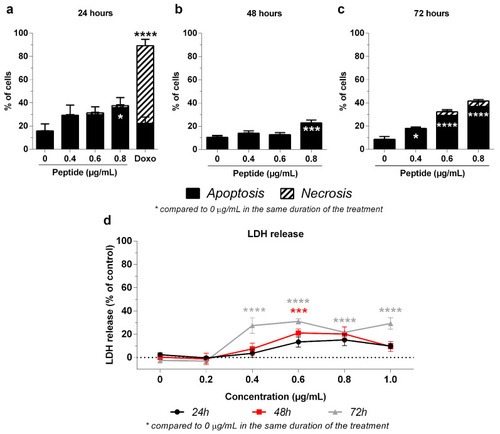
Effect of 3-NAntC in apoptosis/necrosis profile of the MDA-MB-231 cell line. (a–c) A flow cytometry with Annexin V and Propidium iodide labeling was performed. Cells were treated with the peptide 3-NAntC (0–0.8 µg/mL) or with doxorubicin (0.2 µg/mL) for 24, 48, and 72 h. 3-NAntC induced cell death by apoptosis with a very low amount of necrosis. Data are shown as a mean ± SEM of at least three independent assays. (d) LDH release assay. Cells were treated with the 3-NAntC peptide (0–1.0 µg/mL) for 24, 48, and 72 h and the LDH release was quantified. There is no significant difference in this biomarker, suggesting no involvement of either necrosis or pyroptosis as a primary cell death mechanism. Data are shown as mean ± SEM of at least three independent assays in triplicate. Significant differences between control (0 µg/mL) and treated cells are designated as * p < 0.05, *** p < 0.001, and **** p < 0.0001, according to the two-way ANOVA and Dunnett post hoc test.
Acknowledgments
This image is the copyrighted work of the attributed author or publisher, and
ZFIN has permission only to display this image to its users.
Additional permissions should be obtained from the applicable author or publisher of the image.
Full text @ Molecules
Your Input Welcome
Thank you for submitting comments. Your input has been emailed to ZFIN curators who may contact you if
additional information is required.
Oops. Something went wrong. Please try again later.