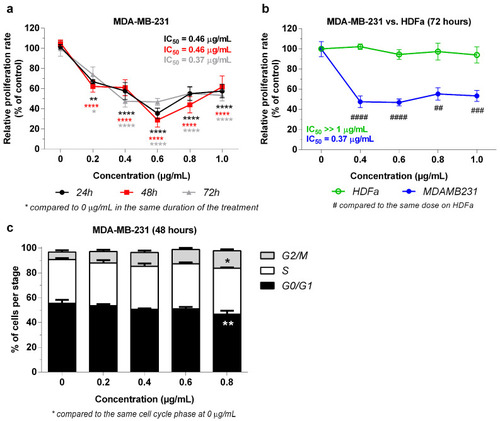
Antiproliferative effects of 3-NAntC in TNBC and normal cells. (a,b) Cellular proliferation assay using the BrdU incorporation method. MDA-MB-231 and HDFa cells were treated with 3-NAntC for 24, 48, and 72 h at a concentration range of 0.2–1.0 µg/mL. Data are shown as a mean ± SEM of at least three independent assays in triplicate. * p < 0.05, ** p < 0.01, and **** p < 0.0001 show significance compared to the control (0 µg/mL), and ## p < 0.01, ### p < 0.001, and #### p < 0.0001 show significance compared to the same concentration in HDFa cell lines according to the two-way ANOVA and a Bonferroni post hoc test. (c) Cell cycle progression assay. Cells were treated with 3-NAntC for 48 h at the concentration range of 0.2–0.8 µg/mL. A flow cytometry assay was conducted with propidium iodide labeling. Data are shown as a mean ± SEM of at least three independent assays. Significant differences between the control (0 µg/mL) and treated cells are designated as * p < 0.05, and ** p < 0.01, according to the two-way ANOVA and Dunnett post hoc test.
|
