
- Title
-
The generation and characterization of a transgenic zebrafish line with lens-specific Cre expression
- Authors
- Peng, X., Jia, X., Shang, G., Xue, M., Jiang, M., Chen, D., Zhang, F., Hu, Y.
- Source
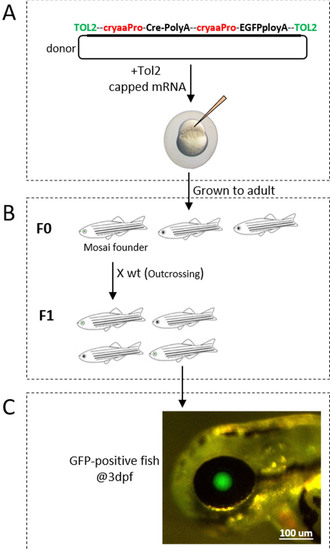
Generation of zTg(cryaa:Cre-cryaa:EGFP) zebrafish. A: Schematic map of the plasmid pTol2-cryaaPro-cre-polyA-cryaaPro-EGFPE-tol2. B: Schematic map of zebrafish breeding to generate F0 and F1 offspring. C: GFP fluorescent signals in 3 dpf lenses of F1 zTg(cryaa:Cre-cryaa:EGFP) transgenic zebrafish. |
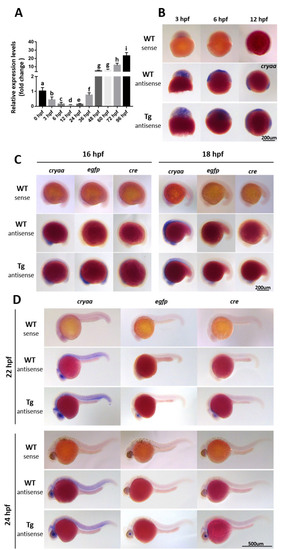
Developmental expression of cryaa, cre, and egfp mRNA in embryonic stages of zTg(cryaa:Cre-cryaa:EGFP) and WT zebrafish. A: qRT-PCR to measure the expression of cryaa mRNA in WT zebrafish during development. Error bars indicate means ± SDs. The different letters above the bars indicate significant differences. n = 3. B: Whole-mount in situ hybridization (WISH) of cryaa mRNA at 3 hpf, 6 hpf, and 12 hpf stages in WT and zTg(cryaa:Cre-cryaa:EGFP; Tg) zebrafish. C, D: WISH of cryaa, egfp, and cre mRNA expression at 16 hpf, 18 hpf, 22 hpf, and 24 hpf in WT and zTg(cryaa:Cre-cryaa:EGFP; Tg) zebrafish. |
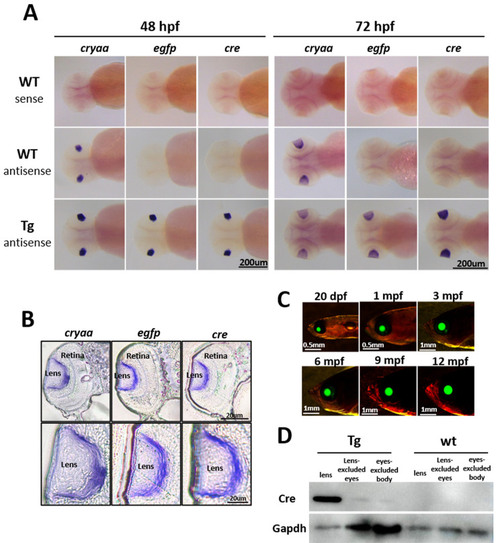
Expression of Cre and EGFP in zTg(cryaa:Cre-cryaa:EGFP) zebrafish. A: Whole-mount in situ hybridization (WISH) of cryaa, egfp, and cre mRNA in 48 and 72 hpf WT and zTg(cryaa:Cre-cryaa:EGFP; Tg) zebrafish. B: Cryosection of 72 hpf Tg embryos of A. C: Fluorescent EGFP was photographed in the lenses of zTg(cryaa:Cre-cryaa:EGFP) zebrafish at the 20 dpf, 1 mpf, 3 mpf, 6 mpf, 9 mpf, and 12 mpf stages. (D) Immunoblot showing the expression of Cre protein and Gapdh in the lens, lens-excluded eye tissue, and eyes-excluded body tissues of WT and zTg(cryaa:Cre-cryaa:EGFP) zebrafish at 15 dpf. |
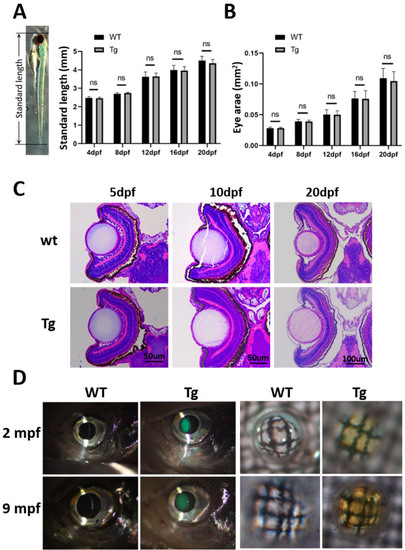
Ectopic expression of Cre and EGFP does not impair zTg(cryaa:Cre-cryaa:EGFP) development. A, B: The standard length from the snout to the origin of the tail fin (A) and the eye area (B) of WT and zTg(cryaa:Cre-cryaa:EGFP) zebrafish were measured using Image J (Wayne Rasband, National Institutes of Health) and analyzed by increased age. The eye area calculation range is within the dotted red circle shown in A. Error bars indicate means ± SDs; ns indicates no significant differences; n = 20. C: H&E staining of paraffin-embedded eye sections of 5 dpf, 10 dpf, and 20 dpf WT and Tg-zebrafish. The standard length of the samples was 2.5, 3.1, and 4.4 mm at 5, 10, and 20 dpf, respectively, and the eye area was 0.032, 0.043, and 0.108 mm2 long, respectively. D: Photographs of the lens transparency of WT and Tg zebrafish at the stages of 2 mpf and 9 mpf taken with a split-lamp microscope and a grid transmission image assay. The standard length of the samples was 20.8 and 33.9 mm at 2 and 9 mpf, respectively, and the eye area was 2.37 and 4.26 mm2 long, respectively. |
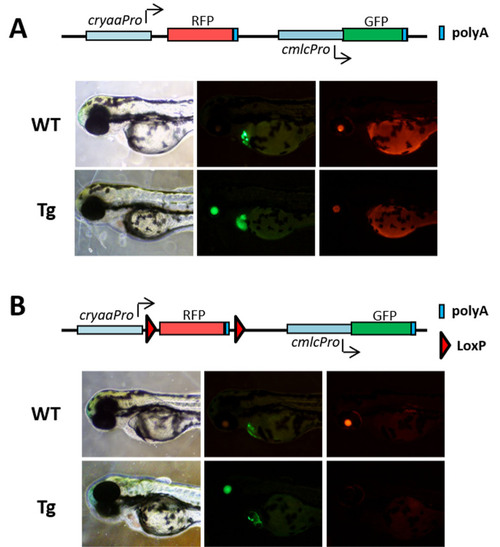
Measurement of Cre activity in the lens of zTg(cryaa:Cre-cryaa:EGFP). A: Schematic map of the pcryaa:RFP-cmlc:EGFP plasmid and images of 2 dpf WT and zTg(cryaa:Cre-cryaa:EGFP; Tg) zebrafish that carried the pcryaa:RFP-cmlc:EGFP plasmids under bright-phase and fluorescence microscopy. RFP fluorescence was specifically expressed in the lens, while GFP was expressed in the heart. B: Schematic map of the pcryaa:loxP-RFP-loxP-cmlc:EGFP plasmid and images of the 2 dpf lenses of WT and zTg(cryaa:Cre-cryaa:EGFP; Tg) zebrafish that were injected with pcryaa:loxP-RFP-loxP-cmlc:EGFP. RFP was specifically expressed in WT zebrafish lenses (upper panel) but not in zTg(cryaa:Cre-cryaa:EGFP) lenses (lower panel). |