
Fig. 5
- ID
- ZDB-IMAGE-240521-6
- Publication
- Peng et al., 2024 - The generation and characterization of a transgenic zebrafish line with lens-specific Cre expression
- All Figures
- Figures for Peng et al., 2024
|
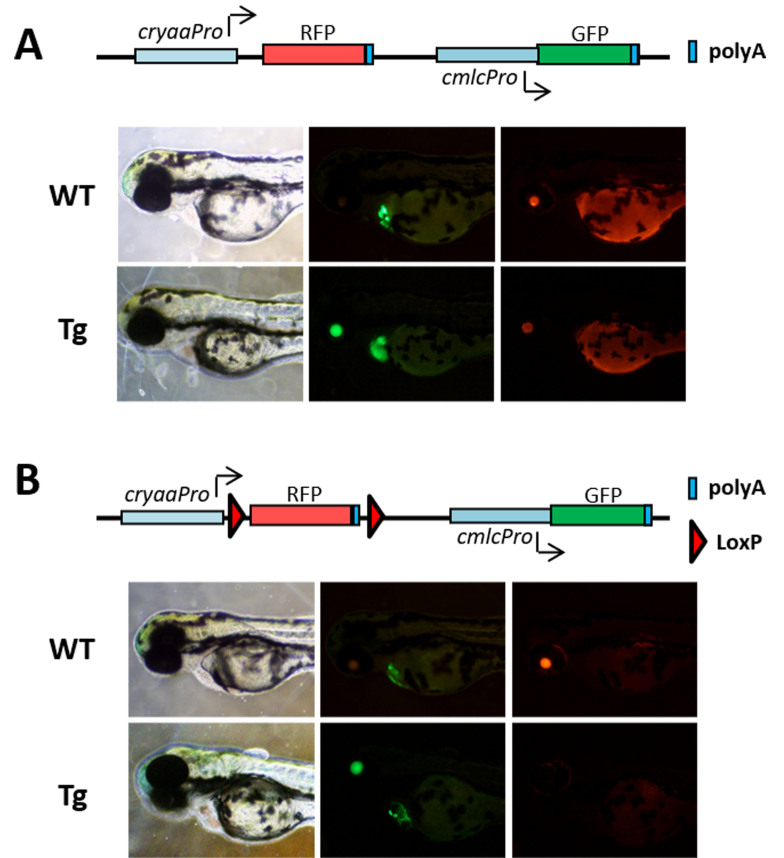
Fig. 5 Measurement of Cre activity in the lens of zTg(cryaa:Cre-cryaa:EGFP). A: Schematic map of the pcryaa:RFP-cmlc:EGFP plasmid and images of 2 dpf WT and zTg(cryaa:Cre-cryaa:EGFP; Tg) zebrafish that carried the pcryaa:RFP-cmlc:EGFP plasmids under bright-phase and fluorescence microscopy. RFP fluorescence was specifically expressed in the lens, while GFP was expressed in the heart. B: Schematic map of the pcryaa:loxP-RFP-loxP-cmlc:EGFP plasmid and images of the 2 dpf lenses of WT and zTg(cryaa:Cre-cryaa:EGFP; Tg) zebrafish that were injected with pcryaa:loxP-RFP-loxP-cmlc:EGFP. RFP was specifically expressed in WT zebrafish lenses (upper panel) but not in zTg(cryaa:Cre-cryaa:EGFP) lenses (lower panel).