FIGURE SUMMARY
Title

Assessment of the FRET-based Teen sensor to monitor ERK activation changes preceding morphological defects in a RASopathy zebrafish model and phenotypic rescue by MEK inhibitor

Authors
Fasano, G., Petrini, S., Bonavolontà, V., Paradisi, G., Pedalino, C., Tartaglia, M., Lauri, A.
Source
Full text @ Mol. Med.
3

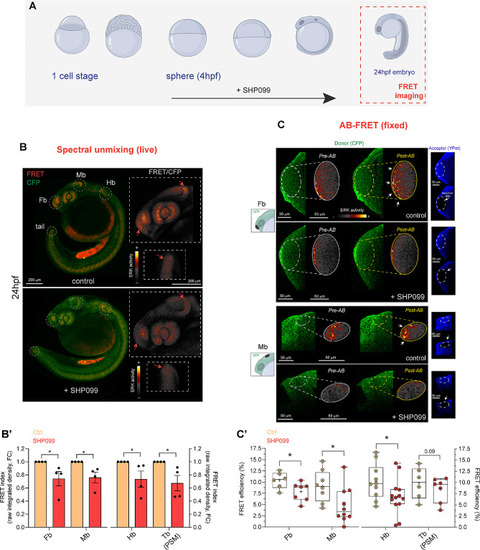
Decreased ERK activity in live and fixed Teen embryos upon prolonged SHP099 exposure is captured by spectral unmixing- and AB-FRET. (A) Schematics depicting the prolonged treatment with the Shp2 inhibitor SHP099 during zebrafish development from sphere stahe till 24 hpf (red square), stage employed in FRET imaging. (B) Representative sum-intensity projections of confocal x,y,λ,z live scans obtained by spectral unmixing from four embryos (treated either with DMSO vehicle control or with SHP099) showing FRET signal (red) and CFP (donor, green) emission. A FRET decrease, quantified in the different brain regions (Fb: forebrain, Mb: midbrain, Hb: hindbrain) and tail region (tailbud presomitic mesoderm, Tb PSM), is marked by dashed white circles and indicated by red arrows in insets, showing close-ups of the sum-intensity projections for the ratiometric image (FRET/CFP). Ratiometric images are rendered with the “smart” LUT intensity scale showing FRET signal correlating to ERK activity. (B’) Bar graphs reporting the quantification and statistical support for FRET/CFP ratio (raw integrated density, arbitrary units, a.u. defined as “FRET index”) and expressed as fold change (FC) of treated vs. control fish. Data are expressed as mean ± SEM of four independent biological replicates, n of embryos = 4. (C) Representative AB-FRET images before (Pre-AB panel) and after (Post-AB panel) AB-FRET. Acceptor bleaching in various regions (ROI 1, forebrain, Fb; ROI2, midbrain, Mb) is outlined by white dotted ellipses. In the schematics on the left ROI 1 and 2 are indicated with a black ellipse and shown on the right panel (Acceptor YPet, white arrows). Fb and Mb regions are sampled from the same embryo. (C’) The graph reports the FRET efficiency (E%) expressed as median with interquartile range from AB-FRET data for Fb and Mb (left panel) and Hb and Tb (PSM, right panel). In B’ and C’ one-tail t-test is used to assess statistical significance (*p < 0.05). For Control fish n  = 6, 8, 10, 6 (Fb, Mb, Hb and Tb, respectively). For SHP099-treated fish n  = 7, 10, 13, 7 (Fb, Mb, Hb and Tb, respectively). Source data are provided as a Source Data file.

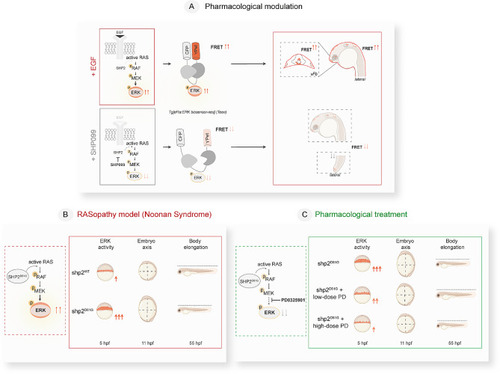
Schematics of the study design and outcome summarizing the main steps and outcomes of pharmacologically- and genetically induced RAS-MAPK pathway modulation assessed in Teen ERK reporter embryos. (A) Positive and negative modulation of RAS-MAPK signaling (via monitoring ERK activation) are obtained through pharmacological approach by acute stimulation with Epidermal growth factor, EGF, or prolonged exposure to the SPH2 inhibitor SHP099, respectively. ERK activation is assessed using the FRET-based ERK sensor Teen. In this study, an increase in the FRET signal in Teen embryos (due to elevated ERK activity) is visible in ventral forebrain upon EGF injection (upper panel). A decrease in FRET signal (due to reduced ERK activity) is visible in different brain domains and tail upon treatment with SHP099 (lower panel). (B, C) Genetic modulation of RAS-MAPK signaling in early embryos of a well-established Shp2D61G-NS zebrafish model (B) and partial rescue obtained by with low- (0.25 µM) and high-dose (1 µM) MEK inhibitor PD0325901 (PD) (C) are assessed by FRET in Teen embryos and precede onset of classical RASopathy morphological hallmarks (embryo axis and body length, validated at 11 hpf and 55 hpf, respectively). pERK: phosphorylated ERK

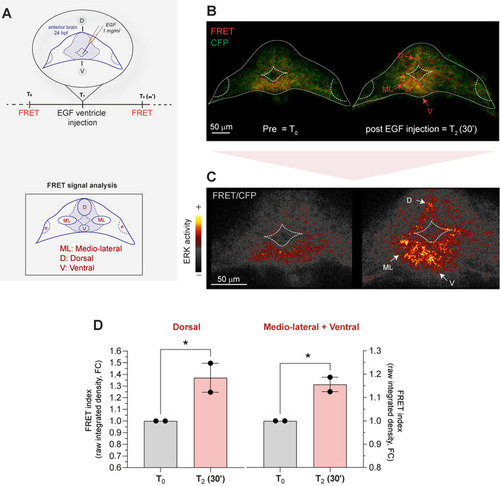
Increase in ERK activity is observed by spectral unmixing-FRET in the forebrain of live Teen embryos upon EGF ventricle injection. (A) The schematics depicts the experimental approach used to stimulate local pERK increase (ERK activity) within the anterior brain upon injection of rat EGF within the forebrain ventricle in live 24 hpf fish. FRET imaging using spectral unmixing mode was performed before (T0) and after T2 (30’) injection (T1). The lower schematics indicates the FRET signal analysis performed in various regions of interest around the ventricle, as indicated in the legend. (B) Representative sum-intensity projections of confocal x,y,z, λ live scans obtained by spectral unmixing from two embryos showing signal relative to FRET (red) and CFP (donor, green) before (pre) and 30 min after EGF injection (pre and post EGF, respectively). Red arrows mark FRET signal increase. D: dorsal, V: ventral, ML: medio-lateral domains. (C) Close ups of the sum-intensity projections of superficial z-layers of the ratiometric image (FRET/CFP) rendered with the “smart” LUT intensity scale and showing high FRET signal correlating to ERK activity (white arrows) in the dorsal (D), mediolateral (ML) and ventral (V) domains. (D) Bar graphs reporting the quantification and statistical support for FRET/CFP ratio (raw integrated density, arbitrary units, a.u. defined as “FRET index”) and expressed as fold change (FC) of treated vs. control fish. Dorsal: quantification in the dorsal domain. Mediolateral + Ventral: FC of the intensity detected in the medio-lateral (mean between right and left side) + the intensity of the ventral domain. Fold change (FC) data are expressed as mean ± SEM of two independent biological replicates, n = 2 embryos. Paired one-tailed t-test is used to assess statistical significance (* p < 0.05). Source data are provided as a Source Data file.

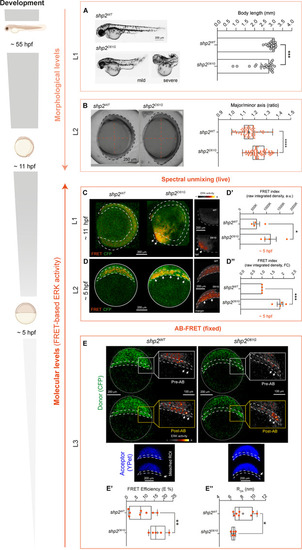
Increased ERK signal measured by spectral unmixing and AB-FRET in Shp2D61G zebrafish mutants showing morphological defects. (A) Representative bright-field micrographs and graphs showing body length measurements of embryos overexpressing the WT and mutant (D61G) form of Shp2 at 55 hpf. Non-parametric Mann Whitney test is used to assess the statistical significance (*** p < 0.001). N = 28 and 23 (Shp2WT and Shp2D61G respectively). Data are expressed as median with interquartile range. (B) Representative bright-field micrographs of mutant embryos at early segmentation stage ( 11 hpf) compared to control fish (expressing Shp2WT). Major and minor axes defects are visible, outlined by a dashed orange lines and by the quantification of major/minor axis ratio. The box plot with the median (middle line), 25th–75th percentiles (box), and min–max values (whiskers) shows the quantification of major/minor axis ratios. One-tail Student t-test is used to assess the statistical significance (**** p < 0.0001). N = 77 and 64 (Shp2WT and Shp2D61G respectively). (C, D) Single plane images of confocal x,y,z,λ,t and sum-intensity projections of confocal x,y,λ,z live scans (C and D, respectively) obtained by spectral unmixing-FRET of embryos at 11 hpf (C) and 5 hpf (D) expressing Shp2WT and Shp2D61G and showing FRET (red) and CFP (donor, green) signals. Increase in ERK activity (FRET channel) in the tail bud (PSM) (C) and in the margin of the animal pole (D) of zebrafish embryos is indicated by white arrows. A dashed white line outlines the developing embryo (C) and the margin (D). Close-ups on the right rendered with “Smart” LUT in Fiji show increased signal in the tail (C) and margin (D) regions. (D’, D’’) Bar graphs reporting the quantification and statistical support for FRET/CFP ratio (raw integrated density, arbitrary units, a.u. defined as “FRET index”) and expressed as raw values (D’) as fold change (FC) of Shp2D61Gvs. Shp2WT (D’’). Data are expressed as mean ± SEM. One-tail t-test is used to assess the statistical significance (* p < 0.05, *** p < 0.001)). N of embryos = 4 (Shp2WT and Shp2D61G). (E) Representative confocal images (single plane) showing donor (CFP, green) before (Donor-Pre) and after (Donor– Post) AB-FRET for embryos expressing Shp2WT and mutants expressing Shp2D61G. A dashed white line indicates the animal pole margin targeted for Acceptor Bleaching (AB). For each condition, insets of the right show close-ups on the donor (CFP) at the margin region before and after AB (pre- and post-, respectively) rendered with “Smart” LUT in Fiji. Bright pixels showing FRET signal increase upon AB are indicated by white arrows. Embryos are outlined by a continuous white line. (E’-E’’) Box plot with median (middle line), 25th–75th percentiles (box), and min–max values (whiskers) showing the quantification of AB-FRET efficiency (E %, E’) and RDA values (nm, E’’) in the margin of zebrafish 5hpf embryos overexpressing WT and mutant (D61G) Shp2. One-tailed t-test is used to assess the statistical significance (* p < 0.05, ** p < 0.01). N = 8 and 5 (Shp2WT and Shp2D61G respectively). L1-L3: different analysis levels for both morphological and molecular assessments. Source data are provided as a Source Data file.

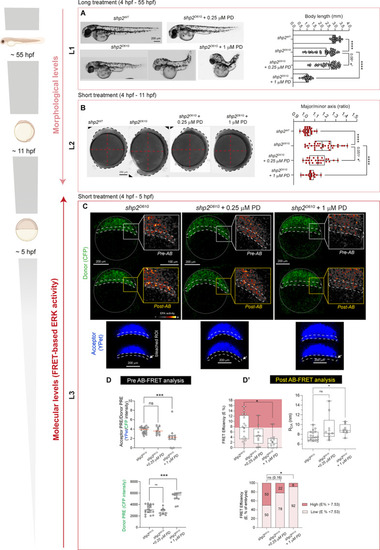
Reduced ERK activity measured by spectral unmixing and AB-FRET in zebrafish Shp2D61G NS-causing mutants exhibiting morphological defects upon low- and high-dose MEK inhibitor treatment. (A) Representative bright-field micrographs of hatched zebrafish embryos expressing Shp2WT, Shp2D61G treated with DMSO vehicle control (Shp2D61G) or with 0.25 µM and 1 µM PD0325901 (PD) since 4 hpf. The bar graph on the right shows body length measurements of zebrafish embryos expressing Shp2D61G and the rescue obtained by low-dose and high-dose PD0325901 treatment. One-way ANOVA with Dunnett’s (a 0.06, **** p < 0.0001) and Holm-Sidak (only for low-dose PD0325901 experimental group, b * p < 0.05) post hoc test is used to assess statistical significance after outliers’ removal (ROUT method Q = 1%). N = 31, 50, 43 and 44 (Shp2WT, Shp2D61G - or + 0.25 µM PD and 1 µM PD respectively). (B) Representative bright-field micrographs of mutant embryos at early segmentation stage treated either with DMSO vehicle control (Shp2D61G) or with 0.25 µM and 1 µM PD compared to control fish (expressing Shp2WT). Major and minor axes defects are visible, outlined by a dashed red line, embryos are outlined by a dashed black line. Quantification of major/minor axis ratio is shown by the box plot with median (middle line), 25th–75th percentiles (box), and min–max values (whiskers). One-way ANOVA with Dunnett’s (a 0.051, * p < 0.05, **** p < 0.0001) and Holm-Sidak (only for low-dose PD0325901 experimental group, b * p < 0.05) post hoc test are used to assess the statistical significance after outliers’ removal (ROUT method Q = 1%). Data are expressed as mean ± SEM of two independent biological replicates. N = 27, 32, 25 and 19 (Shp2WT, Shp2D61G - or + 0.25 µM and 1 µM PD, respectively). (C) Representative confocal images (single plane) showing donor (CFP, green) before (Donor-Pre) and after (Donor–Post) AB-FRET for mutants treated with DMSO vehicle control (Shp2D61G) or with the PD0325901 (Shp2D61G + 0.25 µM and 1 µM PD). A dashed white line indicates the animal pole margin targeted for Acceptor Bleaching (AB). For each condition, insets on the right show close ups on the donor (CFP) at the margin region before and after AB (pre- and post-) rendered with “Smart” LUT in Fiji. The acceptor (YPet, blue) is shown in the small inset below before and after bleaching of the margin region (dashed white line and arrow). Embryos are outlined by a continuous white line. (D) Quantification of signal intensity before AB-FRET. The upper and lower scatter plots (Median and interquartile range) show Acceptor/Donor (YPet, CFP) and CFP signal intensity, respectively. N = 18, 9 and 12 (shp2D61G, Shp2D61G + 0.25 µM PD and Shp2D61G + 1 µM, respectively). A marked reduction in the FRET (and reduced Donor quenching) is observed in NS mutants treated with 1 µM PD. Kruskal-Wallis with Dunn’s post hoc test is used to assess statistical significance (* p < 0.05). Data are expressed as median with interquartile range. N of embryos = 18, 9 and 12 (Shp2D61G, Shp2D61G + 0.25 µM PD and Shp2D61G + 1 µM, respectively). (D’) AB-FRET data quantification represented by the box plot with median (middle line), 25th–75th percentiles (box), and min–max values (whiskers) and showing the AB-FRET efficiency (E %) and RDA values (nm, right inset) in the margin of mutant embryos (Shp2D61G) treated with DMSO vehicle control or low and high-dose of PD0325901 (Shp2D61G + 0.25 µM PD or 1 µM PD, respectively). One-way ANOVA with Dunnett’s post hoc test is used to assess the statistical significance (* p < 0.05). For FRET efficiency (E) dataset, n = 18, 9 and 12 (Shp2D61G, Shp2D61G + 0.25 µM PD and Shp2D61G + 1 µM, respectively). For RDA dataset, values are excluded when E % values = 0 (exclusion criterion reported in the source data file), N = 17, 9 and 8 (Shp2D61G, Shp2D61G + 0.25 µM PD and Shp2D61G + 1 µM, respectively). The lower graph shows the percentage of embryos classified based on high or low values of AB-FRET-derived E (> or < 7.53, respectively). One-sided Chi-square’s test in a 2 × 2 contingency table (shp2D61G vs. Shp2D61G + 0.25 µM PD ns = not statistically significant, Shp2D61G vs. Shp2D61G + 1 µM PD * p < 0.05) is used to assess statistical significance. N = 18, 9, and 12 (Shp2D61G, Shp2D61G + 0.25 µM PD and Shp2D61G + 1 µM, respectively). L1-L3: different analysis levels (L1 and L2, morphological; L3 molecular). Source data are provided as a Source Data file

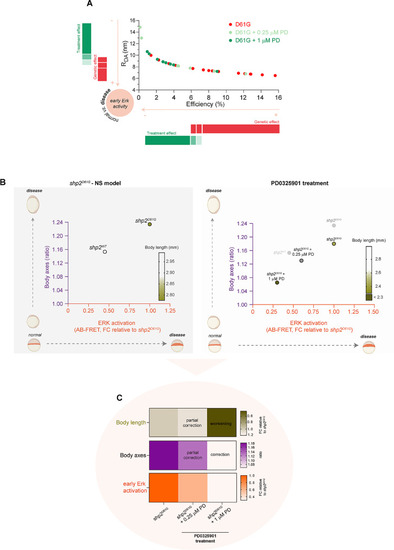
Molecular and morphological effect of the treatment with MEK inhibitor PD0325901 on zebrafish embryos overexpressing Shp2D61G and showing developmental features modeling NS. (A) AB-FRET efficiency (E %, x) and RDA values (nm, y) calculated from AB-FRET on 5 hpf zebrafish embryos expressing mutant (D61G, red) Shp2 - and + treatment with low (0.25 µM, light green) and high (1 µM, dark green) doses of the MEK inhibitor PD0325901. High E values correlating with low RDA values are schematically indicated by a red bar as the “genetic effect” relative to the Shp2D61G allele. On the contrary low E values correlating with high RDA values are indicated by a green bar as the “treatment effect” on the NS mutants due to short PD exposure. N of embryos = 18, 9, 12 (Shp2D61G, Shp2D61G + 0.25 µM PD and Shp2D61G + 1 µM, respectively). (B) Schematics and x,y graph showing the correlation between ERK activation (measured as AB-FRET E FC, x axis) and body axes (measured as ratio between major and minor axis, y axis) in zebrafish embryos expressing Shp2D61G compared to control (Shp2WT) (left) or Shp2D61G treated with DMSO vehicle control or with low- and high- PD doses (right). Modulations of the oval shape of the embryo measured at 11 (y axis) and of ERK activity measured by FRET already at 5 hpf (x axis) are depicted by a schematic illustration. A Heat map on the side of the graph indicates the severity of body shortening at 55hpf (dark bronze = severe). (C) Summary heat maps showing the correlation between ERK activity at 5hpf (orange, bottom graph, obtained by AB-FRET measurement), body axes morphology at 11hpf (violet, middle graph, major/minor axis ratio measurement) and embryo elongation at 55hpf (bronze, upper graph, body length measurement) in NS mutants expressing Shp2D61G treated with DMSO vehicle control or with low (0.25 µM) and high (1 µM) PD0325901 doses. High ERK activity in NS mutants (expressing Shp2D61G) decreases in a dose-dependent manner upon short-time treatment with low and high PD0325901 doses. Accordingly, in a dose-dependent effect partial or complete morphological correction is observed at the level of body axis measured at 11 hpf. Toxicity with prolonged 1 µM PD0325901 treatment is shown for body length (worsening of the body length phenotype measured in embryos at 55 hpf)

Acknowledgments
This image is the copyrighted work of the attributed author or publisher, and ZFIN has permission only to display this image to its users. Additional permissions should be obtained from the applicable author or publisher of the image. Full text @ Mol. Med.