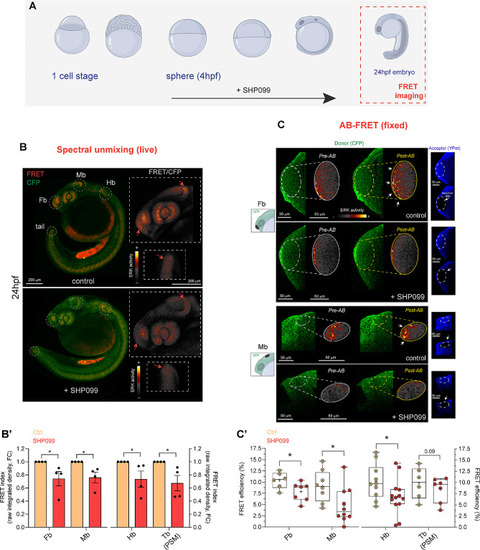
Decreased ERK activity in live and fixed Teen embryos upon prolonged SHP099 exposure is captured by spectral unmixing- and AB-FRET. (A) Schematics depicting the prolonged treatment with the Shp2 inhibitor SHP099 during zebrafish development from sphere stahe till 24 hpf (red square), stage employed in FRET imaging. (B) Representative sum-intensity projections of confocal x,y,λ,z live scans obtained by spectral unmixing from four embryos (treated either with DMSO vehicle control or with SHP099) showing FRET signal (red) and CFP (donor, green) emission. A FRET decrease, quantified in the different brain regions (Fb: forebrain, Mb: midbrain, Hb: hindbrain) and tail region (tailbud presomitic mesoderm, Tb PSM), is marked by dashed white circles and indicated by red arrows in insets, showing close-ups of the sum-intensity projections for the ratiometric image (FRET/CFP). Ratiometric images are rendered with the “smart” LUT intensity scale showing FRET signal correlating to ERK activity. (B’) Bar graphs reporting the quantification and statistical support for FRET/CFP ratio (raw integrated density, arbitrary units, a.u. defined as “FRET index”) and expressed as fold change (FC) of treated vs. control fish. Data are expressed as mean ± SEM of four independent biological replicates, n of embryos = 4. (C) Representative AB-FRET images before (Pre-AB panel) and after (Post-AB panel) AB-FRET. Acceptor bleaching in various regions (ROI 1, forebrain, Fb; ROI2, midbrain, Mb) is outlined by white dotted ellipses. In the schematics on the left ROI 1 and 2 are indicated with a black ellipse and shown on the right panel (Acceptor YPet, white arrows). Fb and Mb regions are sampled from the same embryo. (C’) The graph reports the FRET efficiency (E%) expressed as median with interquartile range from AB-FRET data for Fb and Mb (left panel) and Hb and Tb (PSM, right panel). In B’ and C’ one-tail t-test is used to assess statistical significance (*p < 0.05). For Control fish n = 6, 8, 10, 6 (Fb, Mb, Hb and Tb, respectively). For SHP099-treated fish n = 7, 10, 13, 7 (Fb, Mb, Hb and Tb, respectively). Source data are provided as a Source Data file.
|
