
- Title
-
Application of an eDNA assay for the detection of Pseudoloma neurophilia (Microsporidia) in zebrafish (Danio rerio) facilities
- Authors
- Schuster, C.J., Murray, K.N., Sanders, J.L., Kent, M.L.
- Source
- Full text @ Aquaculture
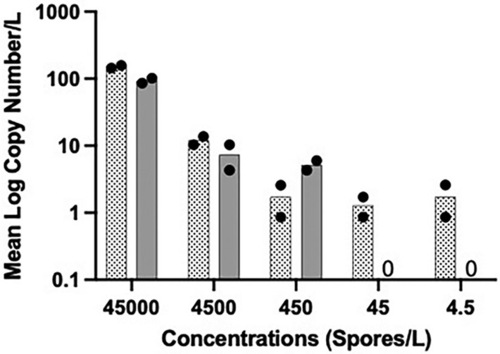
Sensitivity with filters spiked with Pseudoloma neurophilia spores. Two replicate filters were processed for each concentration; Two PCR reactions were conducted for each filter. Dotted bars with the solid circles represent filter 1 and the grey bars with solid circles represent filter 2. The solid circles represent the PCR technical replicates for each sample. |

Water samples were collected over a 10-month experimental exposure. Samples were collected weekly until wk. 9, when the samples were then taken every other week. At each timepoint, 2 filters were taken, thus the grey bars represent filter A, while the black bars represent filter B. A zero (0) indicates that the filter did not have positive detection and the color of each (0) corresponds to either Filter A (grey) or Filter B (black). Active infections are defined here as when fish were positive by histology, weeks 13–45 post exposure as described in Schuster et al. (2022b) |
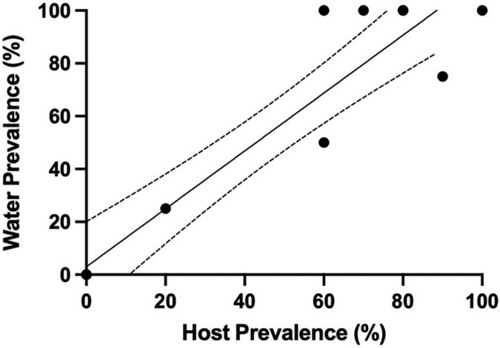
Simple linear regression showing detection in tank water increases as prevalence in tank population increases at the Zebrafish International Resource Center (ZIRC). Individual fish were evaluated by either PCR or histology. Line of best fit (Y = 1.096*X + 0.03041) with 95% confidence intervals (dashed lines) (R2 = 0.88). |