
Image
|
Figure Caption
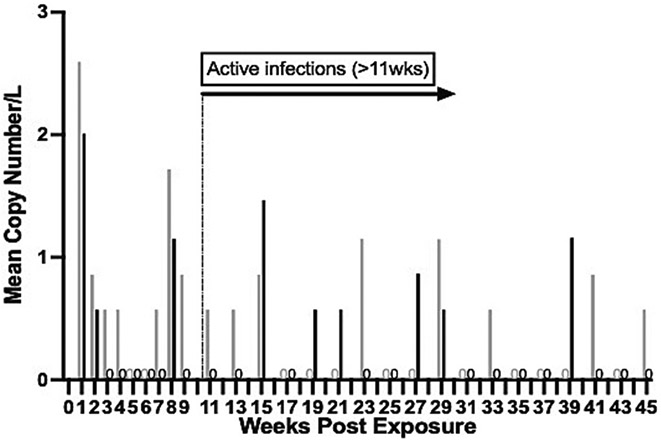
Fig. 2 Water samples were collected over a 10-month experimental exposure. Samples were collected weekly until wk. 9, when the samples were then taken every other week. At each timepoint, 2 filters were taken, thus the grey bars represent filter A, while the black bars represent filter B. A zero (0) indicates that the filter did not have positive detection and the color of each (0) corresponds to either Filter A (grey) or Filter B (black). Active infections are defined here as when fish were positive by histology, weeks 13–45 post exposure as described in Schuster et al. (2022b)
Acknowledgments
This image is the copyrighted work of the attributed author or publisher, and
ZFIN has permission only to display this image to its users.
Additional permissions should be obtained from the applicable author or publisher of the image.
Full text @ Aquaculture