
Image
|
Figure Caption
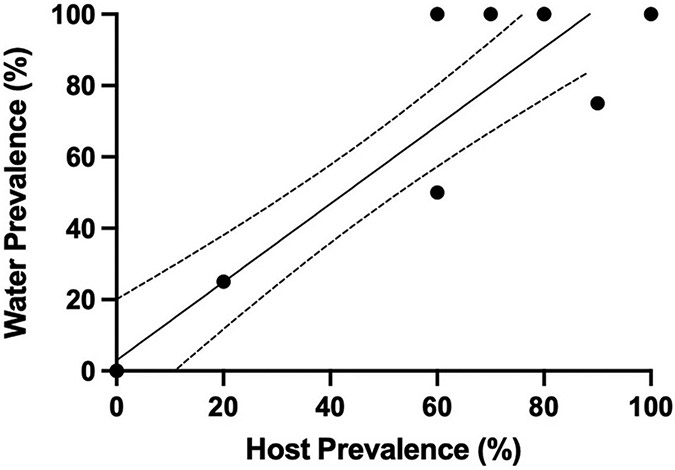
Fig. 3 Simple linear regression showing detection in tank water increases as prevalence in tank population increases at the Zebrafish International Resource Center (ZIRC). Individual fish were evaluated by either PCR or histology. Line of best fit (Y = 1.096*X + 0.03041) with 95% confidence intervals (dashed lines) (R2 = 0.88).
Acknowledgments
This image is the copyrighted work of the attributed author or publisher, and
ZFIN has permission only to display this image to its users.
Additional permissions should be obtained from the applicable author or publisher of the image.
Full text @ Aquaculture