FIGURE SUMMARY
Title

Establishment of a zebrafish inbred strain, M-AB, capable of regular breeding and genetic manipulation

Authors
Sadamitsu, K., Velilla, F., Shinya, M., Kashima, M., Imai, Y., Kawasaki, T., Watai, K., Hosaka, M., Hirata, H., Sakai, N.
Source
Full text @ Sci. Rep.

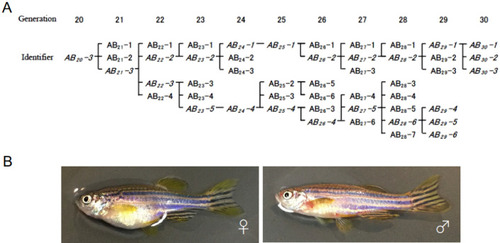
Pedigree of the M-AB strain. (A) Pedigree of the M-AB strain from generation 20 to 30. Pairs in italics indicate pairs that are connected to existing pairs. (B) Female and male fish of the M-AB strain.

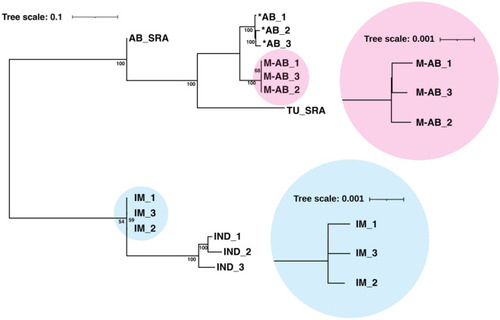
Phylogenetic tree of the M-AB and IM strains. Phylogenetic relationships of the M-AB, *AB, IM and IND strains with open data for AB_SRA and TU_SRA. This tree used 10,000 bootstrap replicates. Coefficients represent bootstrap values for tree nodes. Note that inbred strains have shorter branches than the other strains. The length of the branch indicates the diversity of that strain.

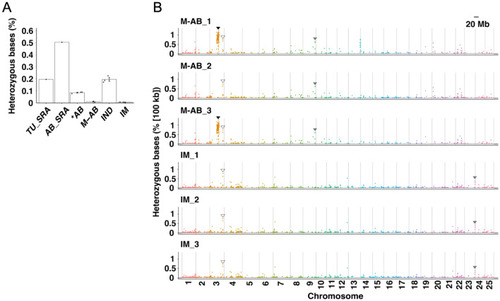
Genomic characteristics of the M-AB and IM strains. (A) The percentages of heterozygous nucleotides (number of heterozygous nucleotides/number of nucleotides in whole genome). Error bars represent the mean ± sem. Plots in the bar graph represent biological replicates. (B) The percentage of heterozygous SNPs in every 100 kb region from chromosomes 1 to 25 is indicated for three M-AB and three IM fish. Areas of interest are marked by triangles. Closed triangles: heterozygous region in two M-AB fish but not in the other M-AB individual; open triangles: heterozygous region common to all M-AB and IM fish, gray triangles: heterozygous region common to only M-AB fish or only IM fish. Detailed count data are available in Table S3.

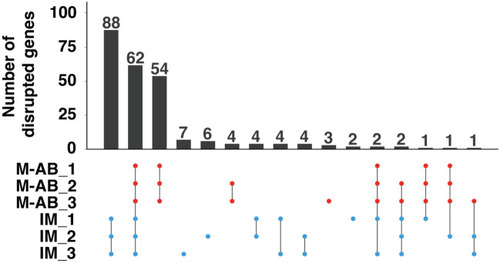
Number of genes potentially disrupted in the M-AB and IM strains. The homozygous SNPs that create nonsense codons or disrupt initiation codons, termination codons or 2-bp splicing junctions within protein coding genes were evaluated as gene disrupting SNPs. The upset plots indicate the overlap of disrupted genes in three M-AB and three IM fish.

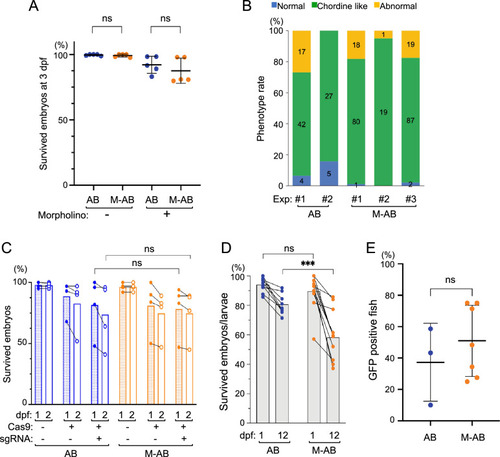
Survival of M-AB embryos was hardly affected by microinjections. (A) Survival of chordin MO-injected M-AB and *AB embryos (n = 5). (B) Approximately 80% of chordin MO-injected embryos showed chordin-deficient phenotypes. The numbers in the color bars indicate the number of samples. (C) Survival of M-AB and *AB embryos injected with sqstm1 sgRNA and/or Cas9 protein (n = 4). (D) Survival of M-AB and *AB embryos/larvae injected with ef1α:EGFP plasmid and tol2 mRNA (n = 9). Plots connected by lines indicate the same experimental group. (E) Percentages of fish (30 dpf) that harbor GFP-transgene detectable by PCR (*AB: n = 3, M-AB: n = 7). Error bars indicate the standard deviation.

Acknowledgments
This image is the copyrighted work of the attributed author or publisher, and ZFIN has permission only to display this image to its users. Additional permissions should be obtained from the applicable author or publisher of the image. Full text @ Sci. Rep.