FIGURE

Figure 3

ID
ZDB-FIG-240401-29
Publication
Sadamitsu et al., 2024 - Establishment of a zebrafish inbred strain, M-AB, capable of regular breeding and genetic manipulation
Other Figures
All Figure Page
Back to All Figure Page
Figure 3

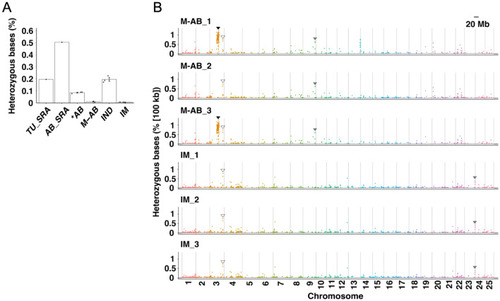
Genomic characteristics of the M-AB and IM strains. (A) The percentages of heterozygous nucleotides (number of heterozygous nucleotides/number of nucleotides in whole genome). Error bars represent the mean ± sem. Plots in the bar graph represent biological replicates. (B) The percentage of heterozygous SNPs in every 100 kb region from chromosomes 1 to 25 is indicated for three M-AB and three IM fish. Areas of interest are marked by triangles. Closed triangles: heterozygous region in two M-AB fish but not in the other M-AB individual; open triangles: heterozygous region common to all M-AB and IM fish, gray triangles: heterozygous region common to only M-AB fish or only IM fish. Detailed count data are available in Table S3.

Expression Data

Expression Detail
Antibody Labeling
Phenotype Data

Phenotype Detail
Acknowledgments
This image is the copyrighted work of the attributed author or publisher, and ZFIN has permission only to display this image to its users. Additional permissions should be obtained from the applicable author or publisher of the image. Full text @ Sci. Rep.